| 2026-02-17 08:20:00+08:00 |
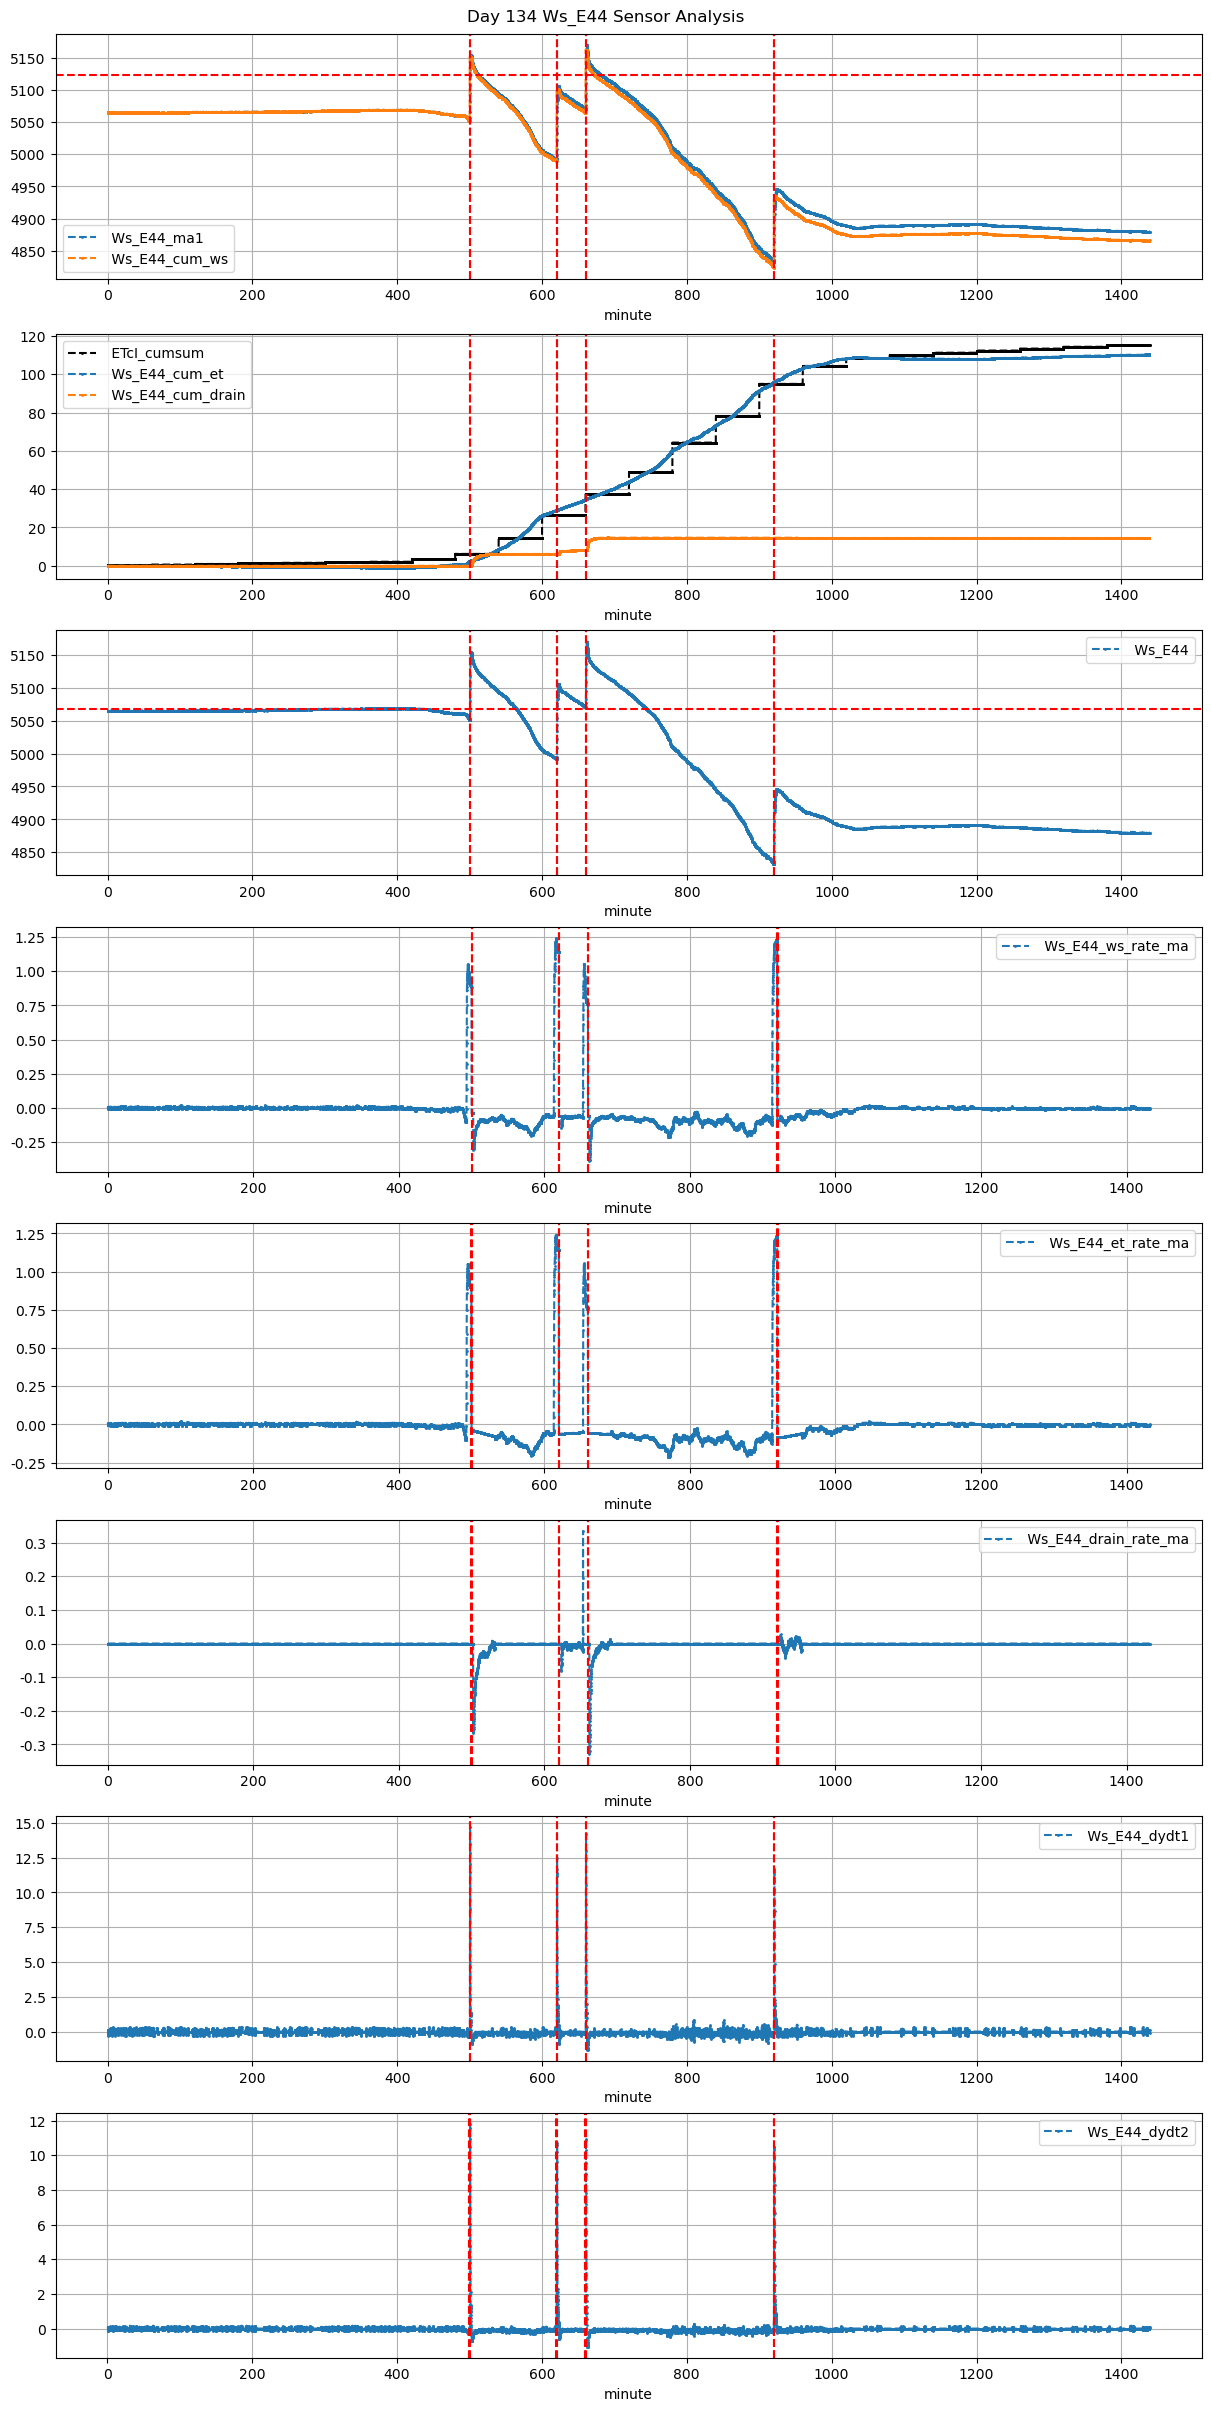
134 |
500 |
Ws_E44 |
0.395893 |
30 |
500.0 |
500.500000 |
500.53 |
502.250000 |
5053.100000 |
5153.722222 |
32 |
-0.039451 |
-0.169441 |
-0.078413 |
0.349333 |
0.628889 |
20.124444 |
True |
30.0 |
103.2 |
20.192000 |
0.1 |
6.268189 |
6.368189 |
1530 |
108 |
-0.192370 |
5122.381278 |
NaN |
NaN |
| 2026-02-17 10:20:00+08:00 |
134 |
620 |
Ws_E44 |
0.395893 |
30 |
620.0 |
620.500000 |
620.53 |
623.333333 |
4993.130159 |
5105.750000 |
32 |
-0.060986 |
-0.071605 |
-0.051235 |
0.242300 |
0.703874 |
22.523968 |
True |
30.0 |
168.2 |
22.523968 |
0.0 |
1.661108 |
1.661108 |
255 |
173 |
-0.018351 |
5097.444461 |
NaN |
NaN |
| 2026-02-17 11:00:00+08:00 |
134 |
660 |
Ws_E44 |
0.395893 |
30 |
660.0 |
660.500000 |
660.53 |
661.916667 |
5071.228571 |
5169.666667 |
32 |
-0.057896 |
-0.158765 |
-0.061414 |
0.372417 |
0.615238 |
19.687619 |
True |
30.0 |
83.2 |
20.192000 |
0.5 |
6.547334 |
7.047334 |
980 |
88 |
-0.190835 |
5136.929995 |
NaN |
NaN |
| 2026-02-17 15:20:00+08:00 |
134 |
920 |
Ws_E44 |
0.395893 |
30 |
920.0 |
920.416667 |
920.53 |
923.750000 |
4834.325000 |
4946.000000 |
32 |
-0.085268 |
-0.088920 |
-0.059148 |
0.199167 |
0.697969 |
22.335000 |
True |
25.0 |
193.2 |
22.335000 |
0.0 |
0.000000 |
0.000000 |
264 |
598 |
-0.031517 |
NaN |
NaN |
NaN |