| 2025-11-18 08:15:00+08:00 |
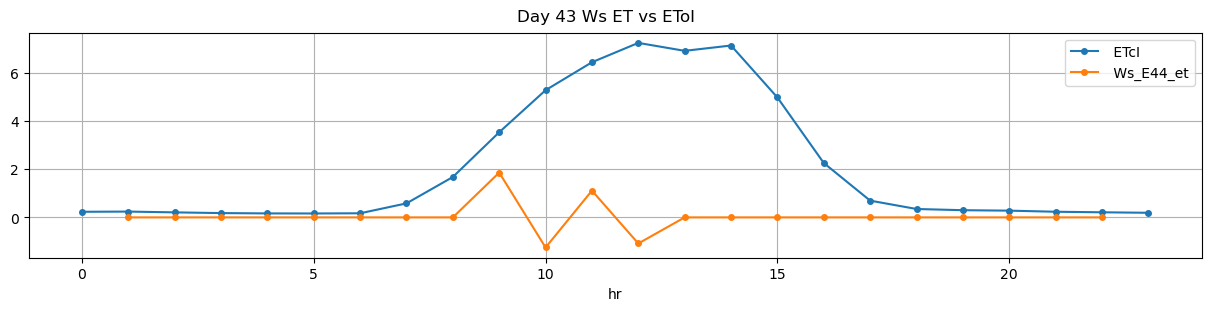
43 |
495 |
Ws_E44 |
1.454948 |
30 |
495.0 |
495.250000 |
495.55 |
497.333333 |
7290.0 |
7390.000000 |
33 |
0.0 |
0.000000 |
0.0 |
0.287500 |
0.606061 |
20.000000 |
True |
15.0 |
107.0 |
20.000000 |
0.0 |
0.000000 |
0.000000 |
NaN |
NaN |
NaN |
NaN |
NaN |
NaN |
| 2025-11-18 09:15:00+08:00 |
43 |
555 |
Ws_E44 |
1.454948 |
30 |
555.0 |
555.250000 |
555.55 |
557.250000 |
7390.0 |
7489.444444 |
33 |
0.0 |
0.000000 |
0.0 |
0.287778 |
0.602694 |
19.888889 |
True |
15.0 |
102.0 |
19.959677 |
0.0 |
0.000000 |
0.000000 |
60.0 |
107.0 |
-0.101389 |
NaN |
NaN |
NaN |
| 2025-11-18 10:15:00+08:00 |
43 |
615 |
Ws_E44 |
1.454948 |
30 |
615.0 |
615.250000 |
615.55 |
617.250000 |
7480.0 |
7579.444444 |
33 |
0.0 |
-0.032047 |
0.0 |
0.287778 |
0.602694 |
19.888889 |
True |
15.0 |
102.0 |
19.959677 |
0.1 |
3.861111 |
3.961111 |
180.0 |
107.0 |
-0.201389 |
7560.138889 |
NaN |
NaN |
| 2025-11-18 11:15:00+08:00 |
43 |
675 |
Ws_E44 |
1.454948 |
30 |
675.0 |
675.333333 |
675.55 |
677.333333 |
7570.0 |
7669.444444 |
33 |
0.0 |
-0.114763 |
0.0 |
0.287778 |
0.602694 |
19.888889 |
True |
20.0 |
107.0 |
19.959677 |
0.1 |
5.861111 |
5.961111 |
360.0 |
112.0 |
-0.279167 |
7640.138889 |
NaN |
NaN |
| 2025-11-18 12:15:00+08:00 |
43 |
735 |
Ws_E44 |
1.454948 |
30 |
735.0 |
733.916667 |
735.55 |
737.333333 |
7640.0 |
7749.444444 |
33 |
0.0 |
-0.032047 |
0.0 |
0.255000 |
0.663300 |
21.888889 |
True |
-65.0 |
107.0 |
21.888889 |
0.0 |
3.861111 |
3.861111 |
120.0 |
112.0 |
-0.206944 |
7730.138889 |
NaN |
NaN |