| 2025-11-26 08:51:05+08:00 |
51 |
531 |
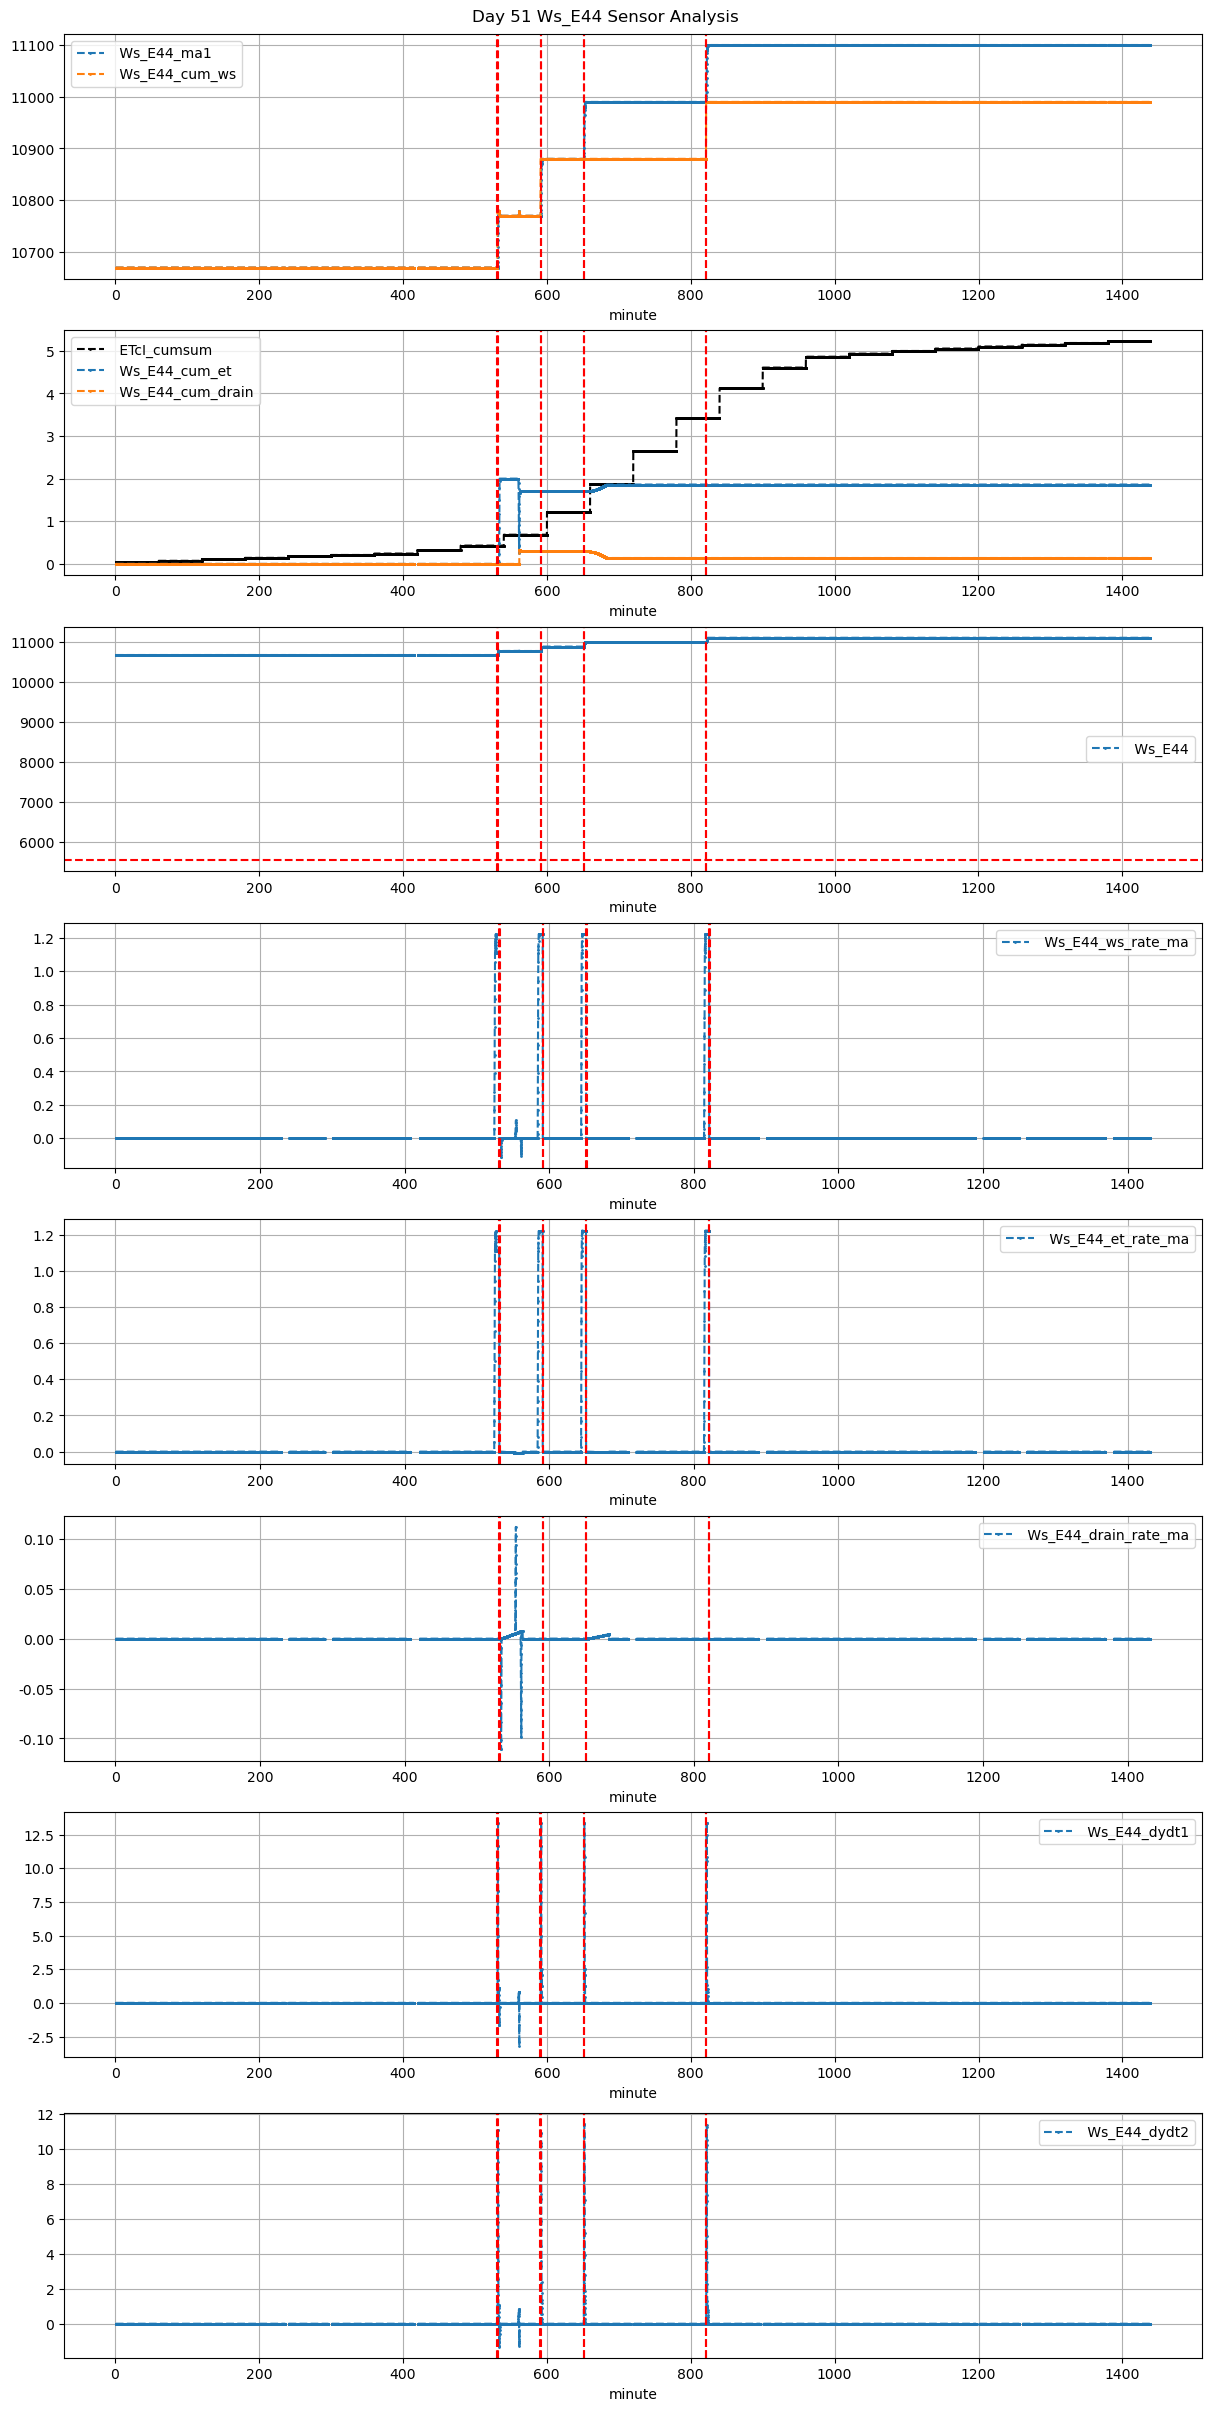
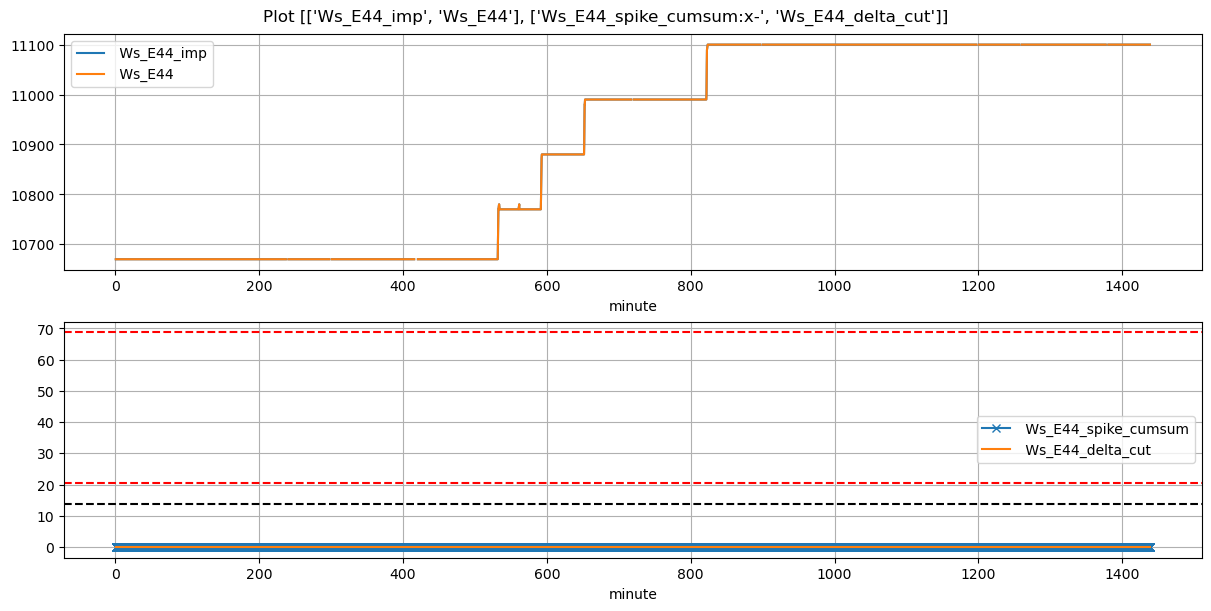
Ws_E44 |
1.960364 |
30 |
531.08 |
531.583333 |
531.66 |
533.416667 |
10670.0 |
10780.0 |
35 |
0.000000 |
-0.007407 |
-0.008025 |
0.360000 |
0.628571 |
22.0 |
True |
30.2 |
105.4 |
23.345 |
0.0 |
0.0 |
0.0 |
39.0 |
110.0 |
-0.111068 |
NaN |
NaN |
NaN |
| 2025-11-26 09:51:05+08:00 |
51 |
591 |
Ws_E44 |
1.960364 |
30 |
591.08 |
591.500000 |
591.66 |
592.916667 |
10770.0 |
10880.0 |
35 |
0.000000 |
0.000000 |
0.000000 |
0.388571 |
0.628571 |
22.0 |
True |
25.2 |
75.4 |
23.345 |
0.0 |
0.0 |
0.0 |
NaN |
NaN |
NaN |
NaN |
NaN |
NaN |
| 2025-11-26 10:51:05+08:00 |
51 |
651 |
Ws_E44 |
1.960364 |
30 |
651.08 |
651.666667 |
651.66 |
653.000000 |
10880.0 |
10990.0 |
35 |
-0.004501 |
0.000000 |
-0.004501 |
0.401429 |
0.628571 |
22.0 |
False |
35.2 |
80.4 |
NaN |
0.0 |
0.0 |
0.0 |
NaN |
NaN |
NaN |
NaN |
NaN |
NaN |
| 2025-11-26 13:41:12+08:00 |
51 |
821 |
Ws_E44 |
1.960364 |
30 |
821.20 |
821.666667 |
821.78 |
823.500000 |
10990.0 |
11100.0 |
35 |
0.000000 |
0.000000 |
0.000000 |
0.361714 |
0.628571 |
22.0 |
True |
28.0 |
103.2 |
23.345 |
0.0 |
0.0 |
0.0 |
NaN |
NaN |
NaN |
NaN |
NaN |
NaN |