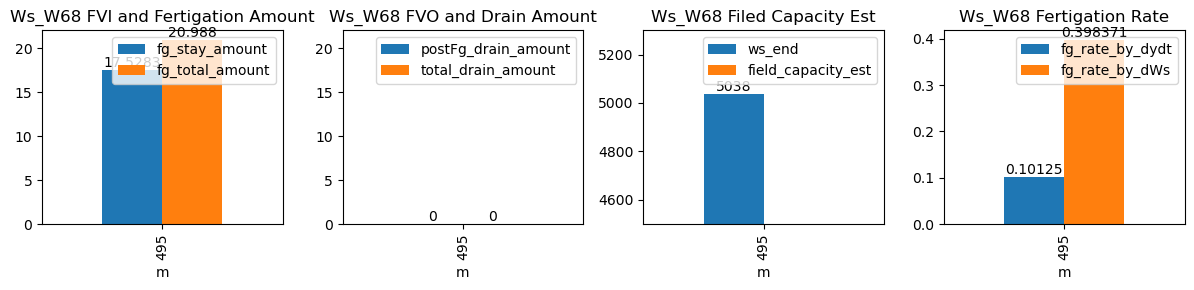
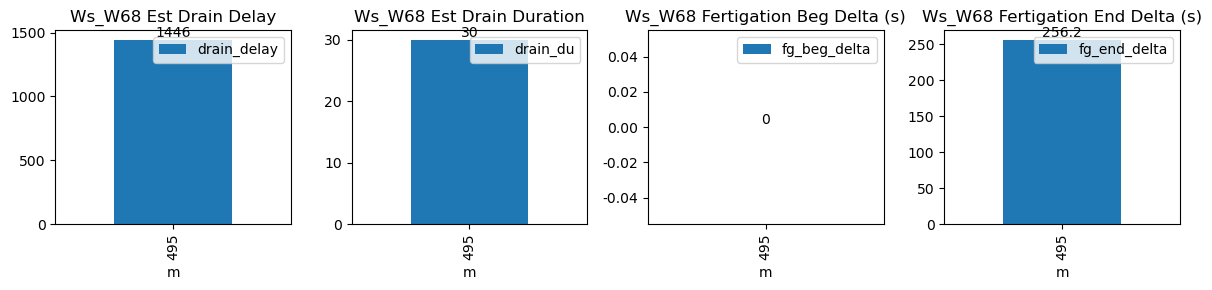
VI and VO Daily Summary
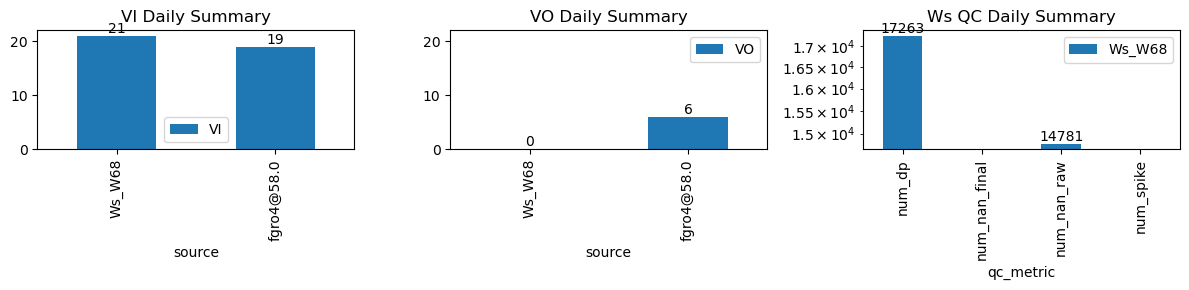
| ws_name | num_dp | num_nan_raw | num_nan_final | num_spike | cum_step_adj |
|---|---|---|---|---|---|
| Ws_W68 | 17,263 | 14,781 | 0 | 0 | 0.00 |
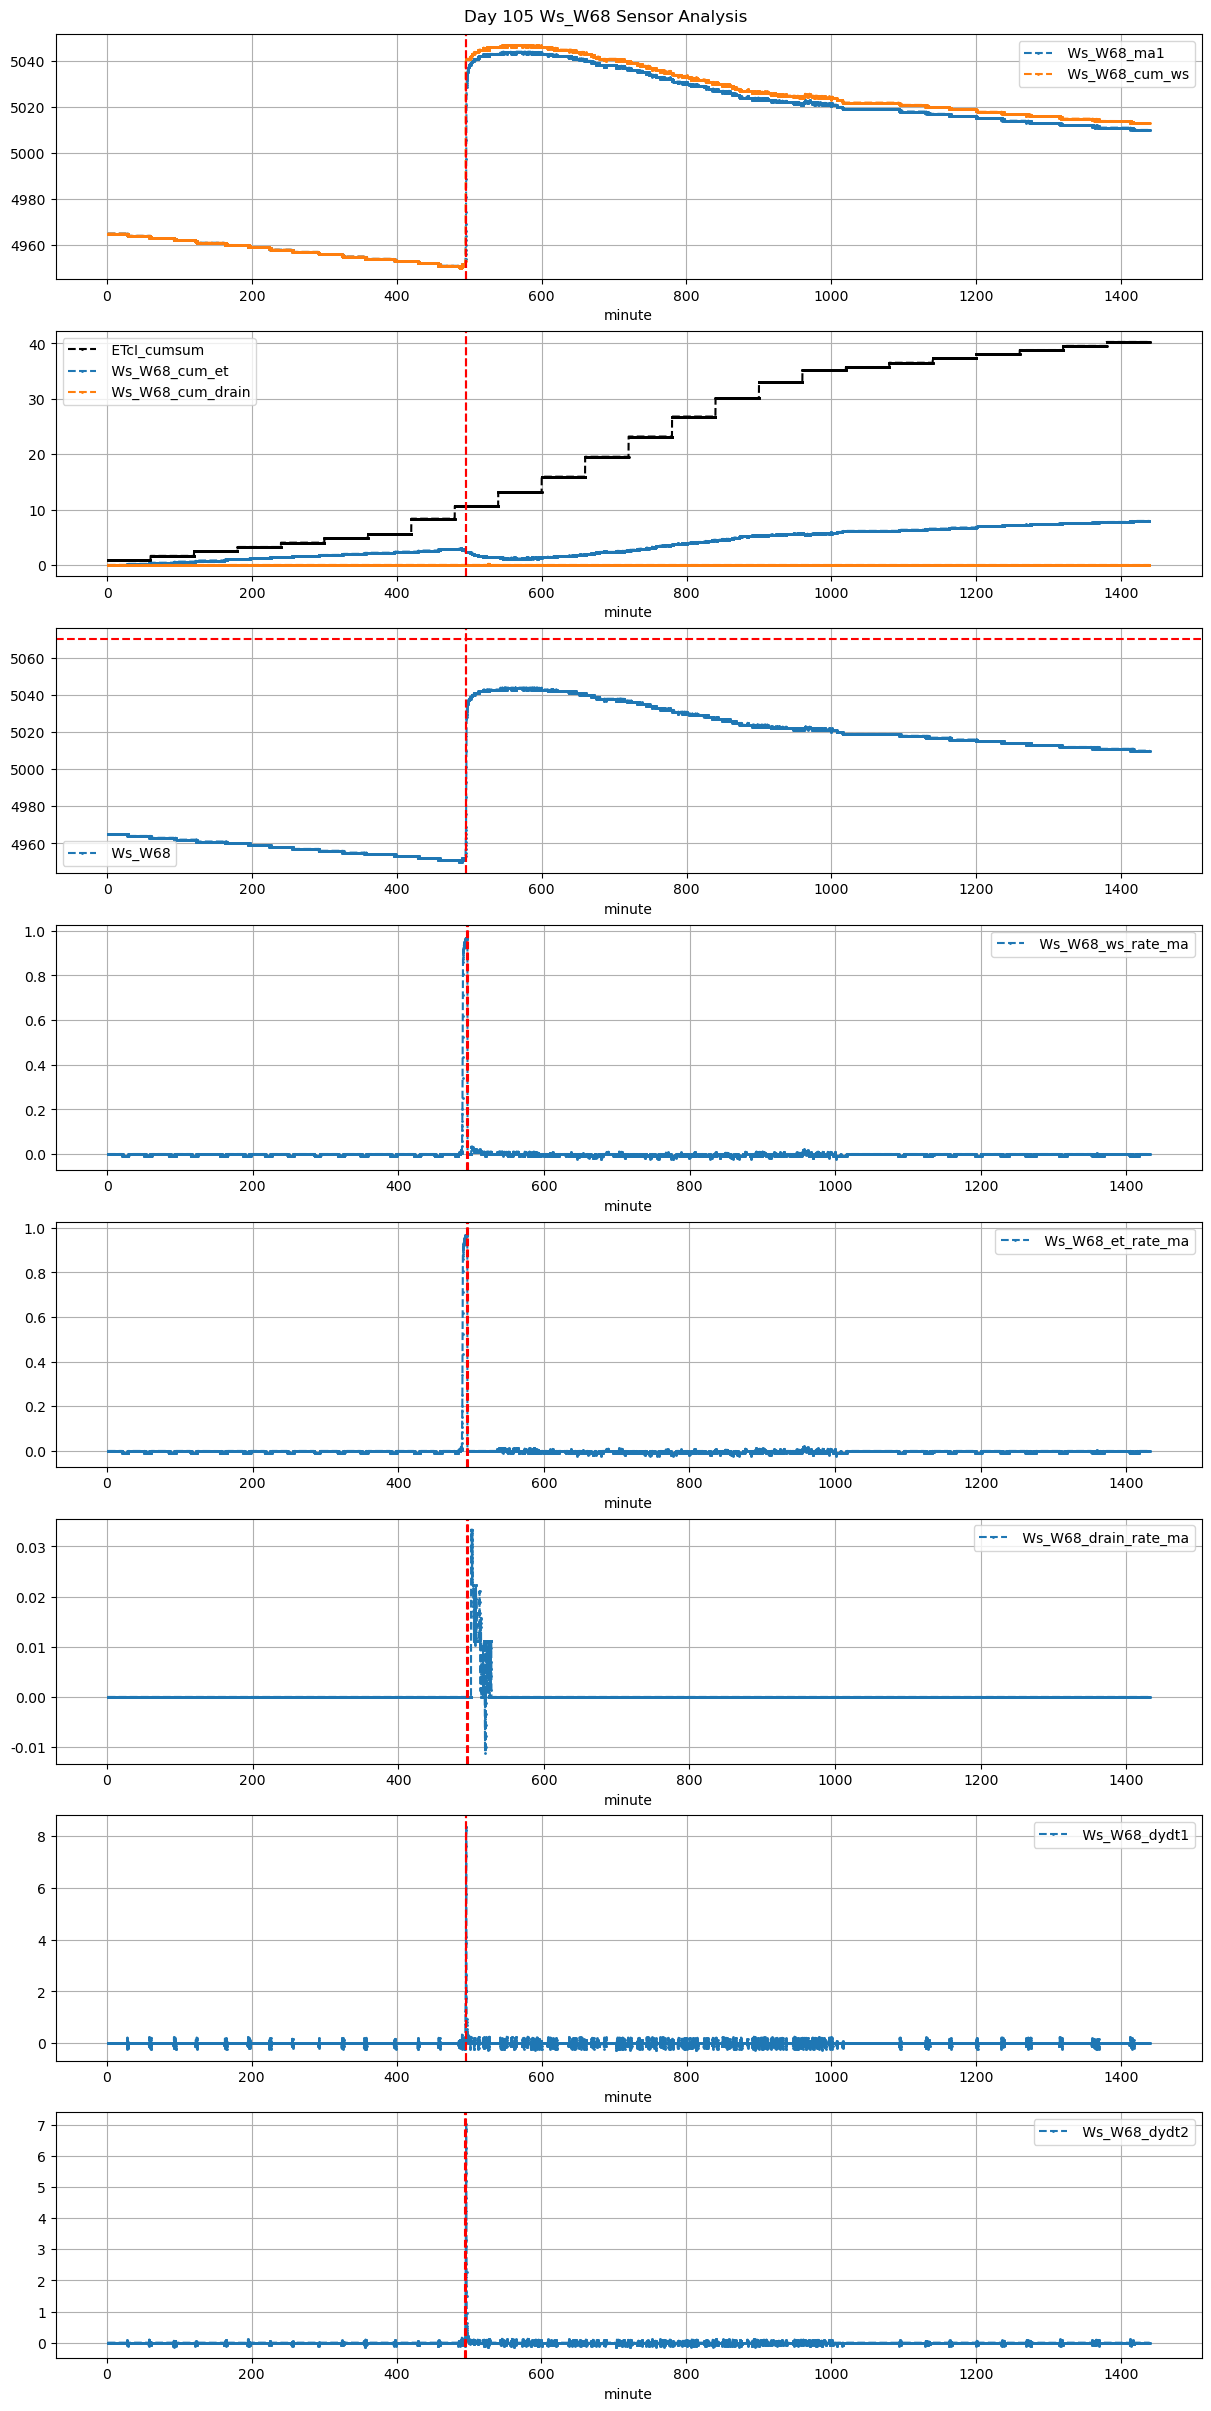
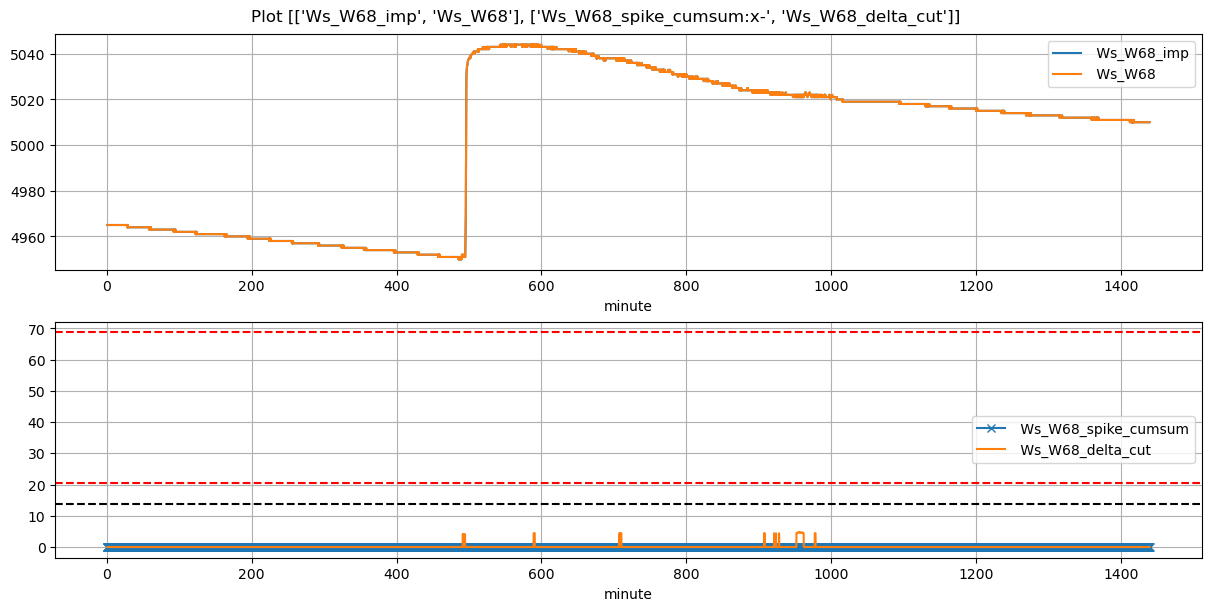
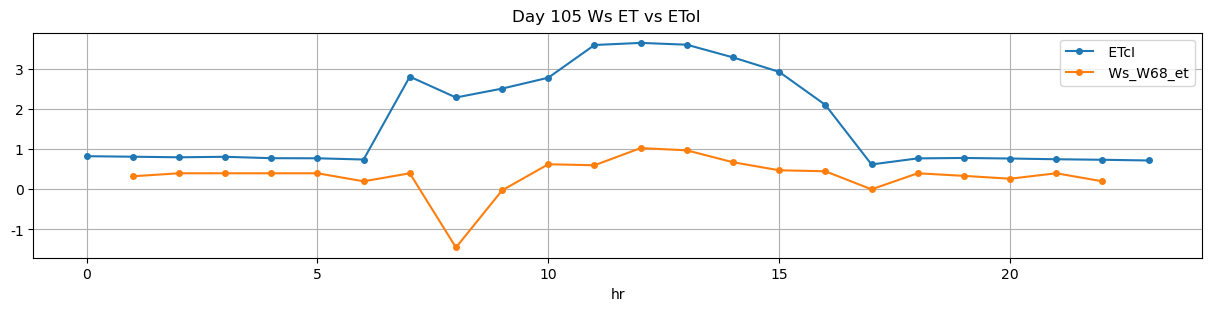
| ds | d | m | ws_name | prominence_cut | max_drain_du | fg_beg | fg_beg_est | fg_end | fg_end_est | ws_beg | ws_end | duc | pre_fg_et | post_fg_ws | post_drn_et | fg_rate_by_dydt | fg_rate_by_dWs | fg_stay_amount | enough_data | fg_beg_delta | fg_end_delta | fg_total_amount | fg_drain_amount | postFg_drain_amount | total_drain_amount | drain_du | drain_delay | drain_rate | field_capacity_est |
|---|---|---|---|---|---|---|---|---|---|---|---|---|---|---|---|---|---|---|---|---|---|---|---|---|---|---|---|---|---|
| 2026-01-19 08:15:00+08:00 | 105 | 495 | Ws_W68 | 0.108767 | 30 | 495.0 | 495.0 | 495.73 | 499.833333 | 4951.0 | 5038.0 | 44 | 0.0 | 0.0 | 0.0 | 0.11025 | 0.395455 | 17.4 | True | 0.0 | 246.2 | 20.988 | 0.0 | 0 | 0.0 | 9 | 356 | -0.232254 | NaN |