| 2026-03-20 07:40:00+08:00 |
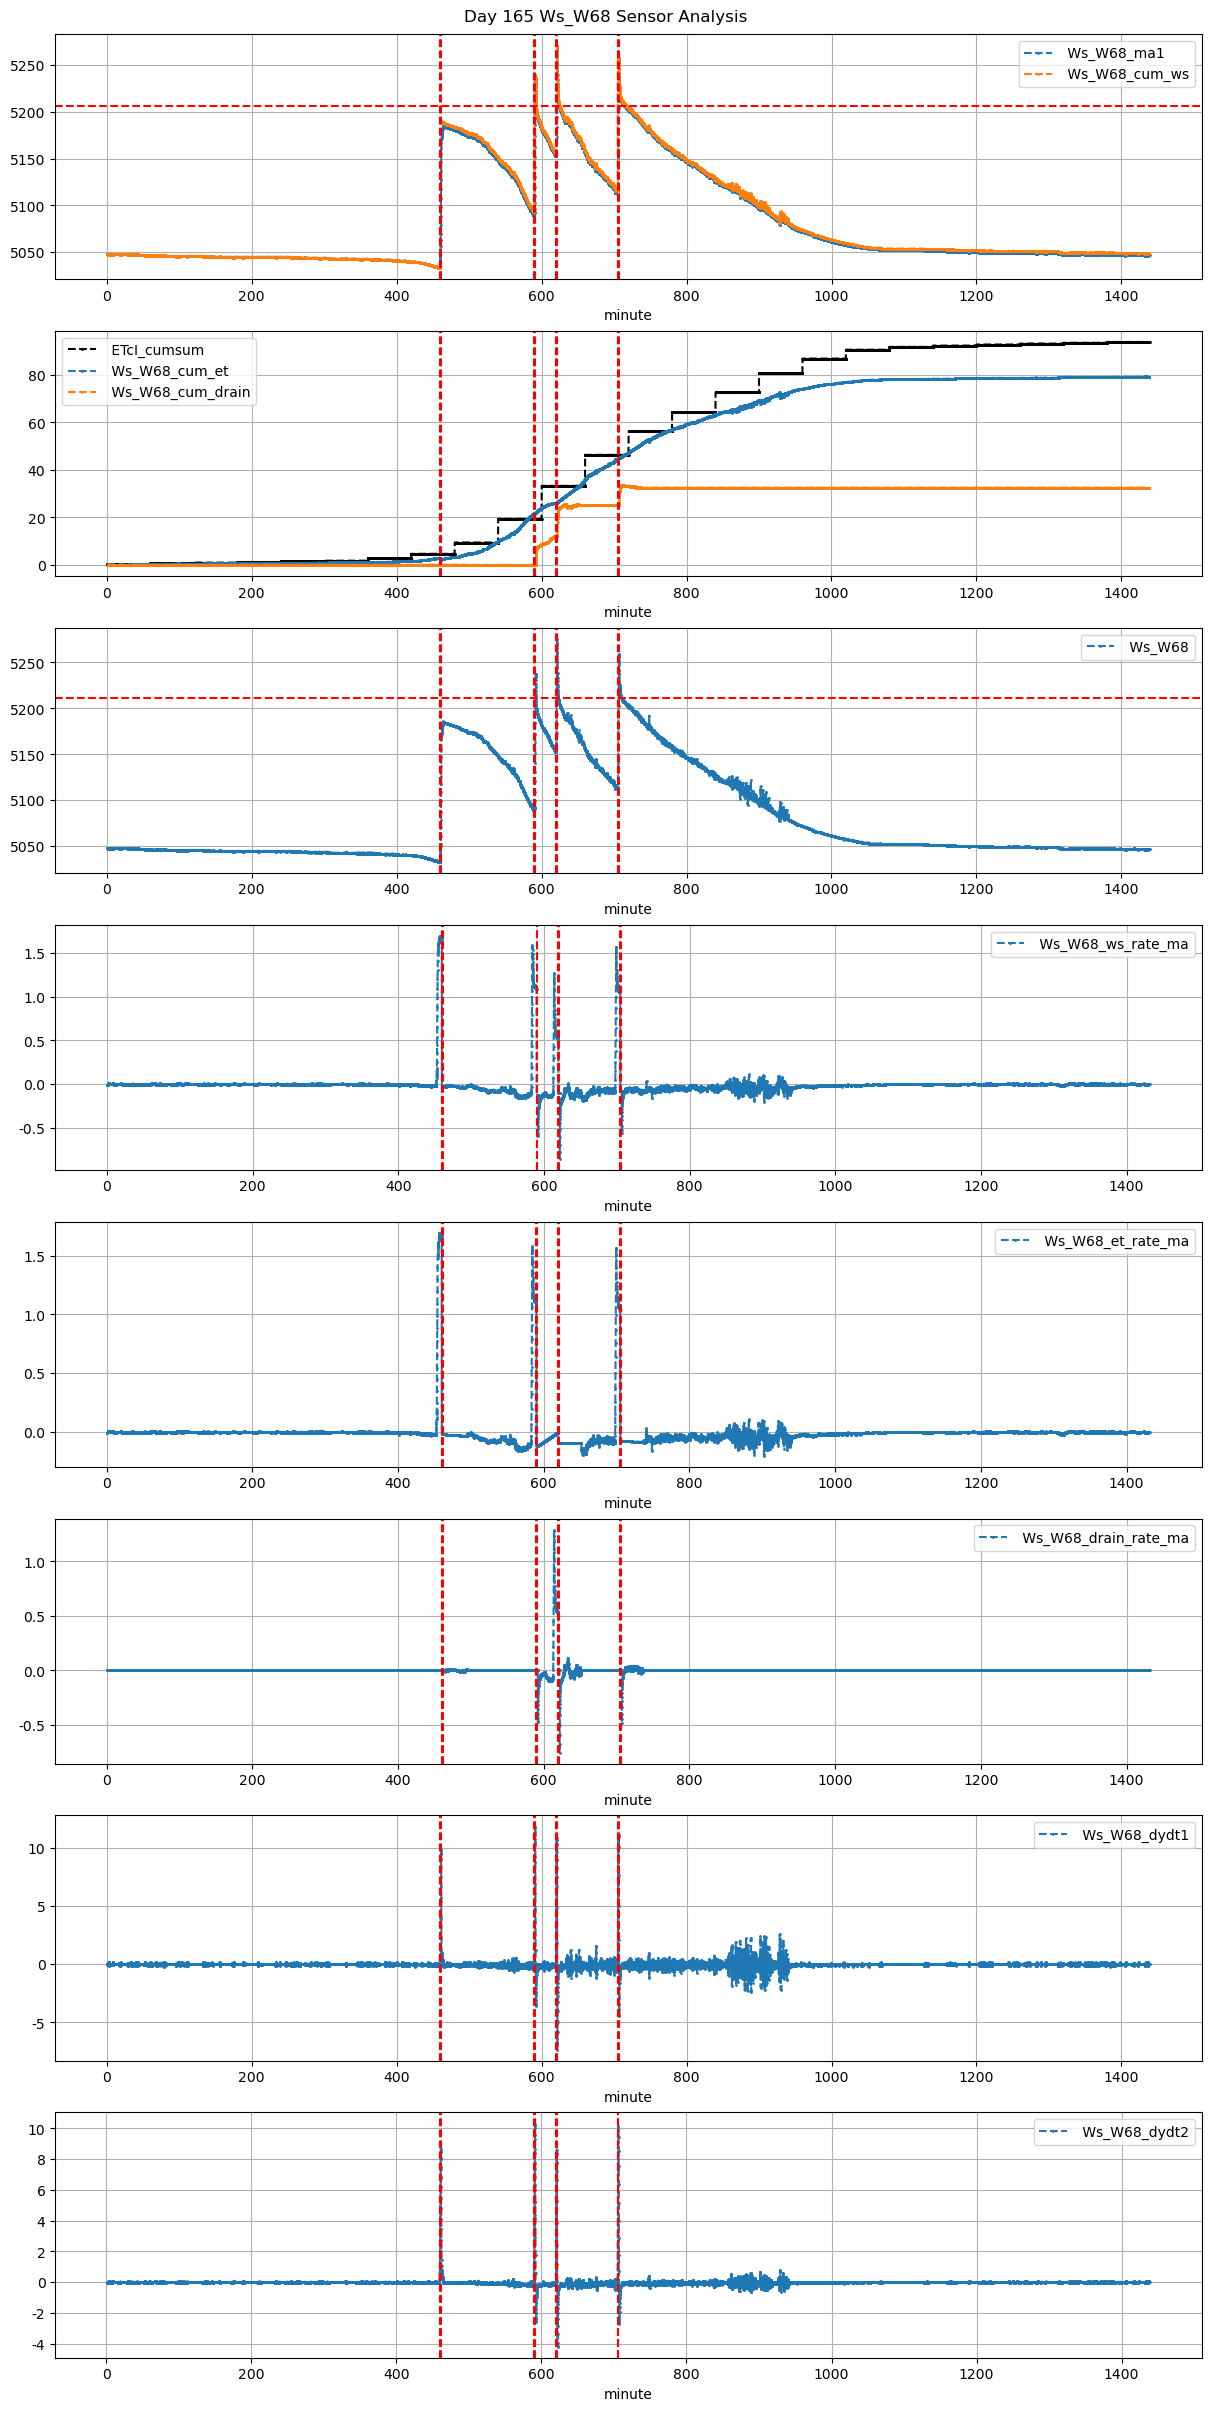
165 |
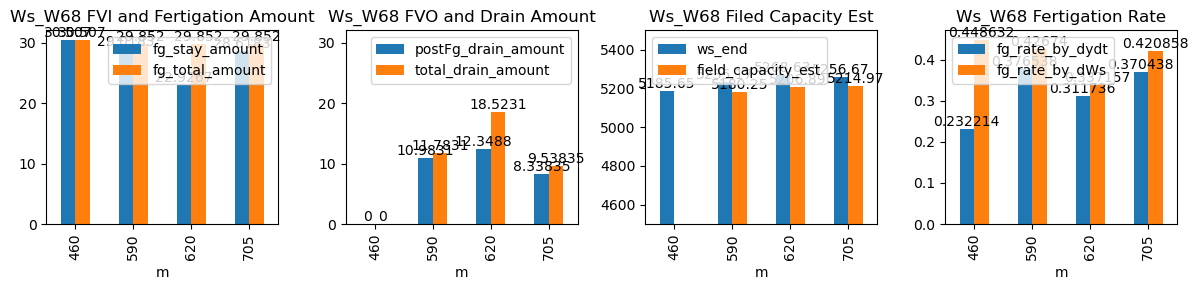
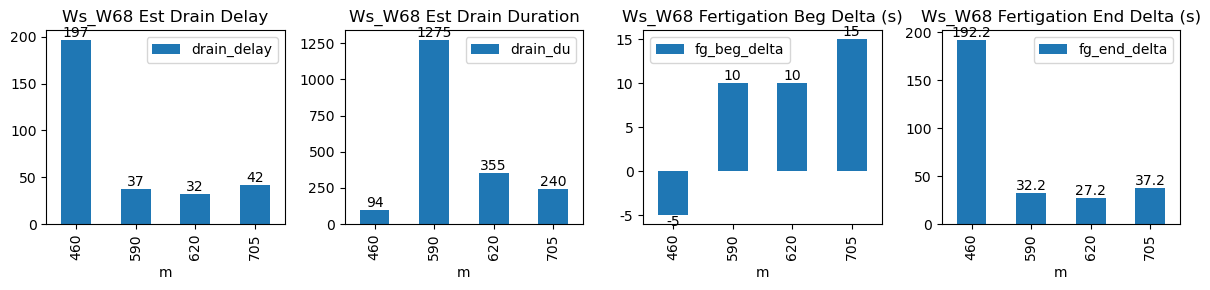
460 |
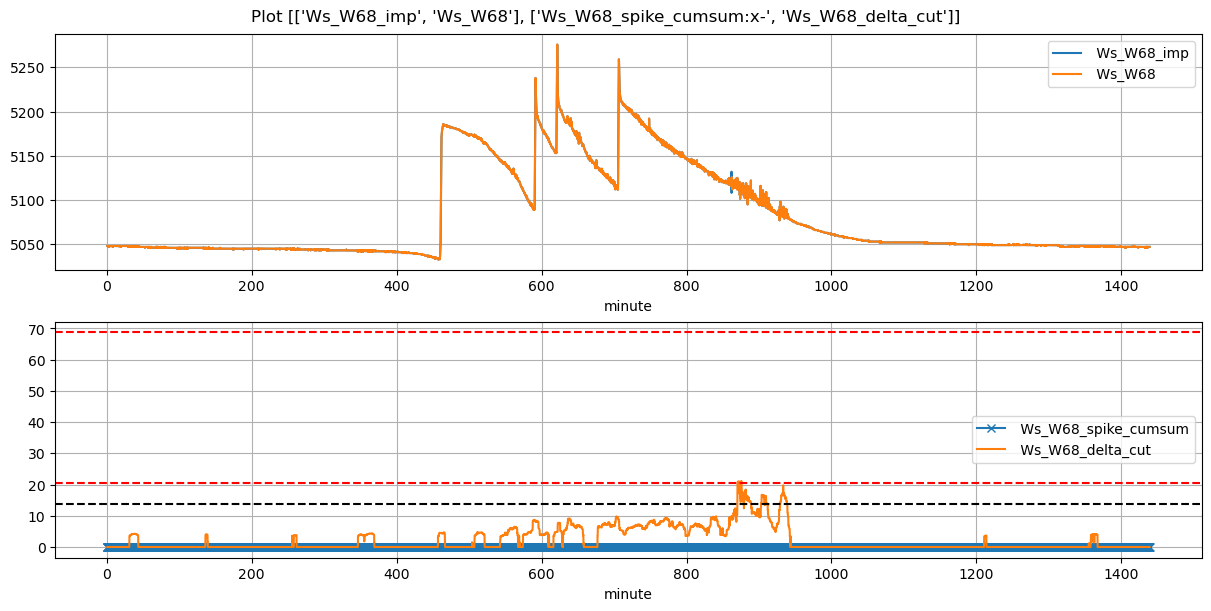
Ws_W68 |
0.68506 |
30.000000 |
460.0 |
459.916667 |
461.13 |
464.333333 |
5033.115 |
5185.650000 |
68 |
-0.019341 |
-0.020360 |
-0.032778 |
0.232214 |
0.448632 |
30.507000 |
True |
-5.0 |
192.2 |
30.507 |
0.000000 |
0.000000 |
0.000000 |
94 |
197 |
-0.012554 |
NaN |
| 2026-03-20 09:50:00+08:00 |
165 |
590 |
Ws_W68 |
0.68506 |
28.333333 |
590.0 |
590.166667 |
591.13 |
591.666667 |
5090.075 |
5235.166667 |
68 |
-0.118117 |
-0.197550 |
0.000000 |
0.376538 |
0.426740 |
29.018333 |
True |
10.0 |
32.2 |
29.852 |
0.800000 |
10.983129 |
11.783129 |
1275 |
37 |
-0.135546 |
5180.251022 |
| 2026-03-20 10:20:00+08:00 |
165 |
620 |
Ws_W68 |
0.68506 |
30.000000 |
620.0 |
620.166667 |
621.13 |
621.583333 |
5154.000 |
5268.633333 |
68 |
-0.096518 |
-0.199856 |
-0.092150 |
0.311736 |
0.337157 |
22.926667 |
True |
10.0 |
27.2 |
29.852 |
6.174379 |
12.348759 |
18.523138 |
355 |
32 |
-0.170295 |
5206.889539 |
| 2026-03-20 11:45:00+08:00 |
165 |
705 |
Ws_W68 |
0.68506 |
30.000000 |
705.0 |
705.250000 |
706.13 |
706.750000 |
5113.575 |
5256.666667 |
68 |
-0.077195 |
-0.126548 |
-0.082274 |
0.370438 |
0.420858 |
28.618333 |
True |
15.0 |
37.2 |
29.852 |
1.200000 |
8.338355 |
9.538355 |
240 |
42 |
-0.215765 |
5214.974893 |