| 2026-03-22 08:10:00+08:00 |
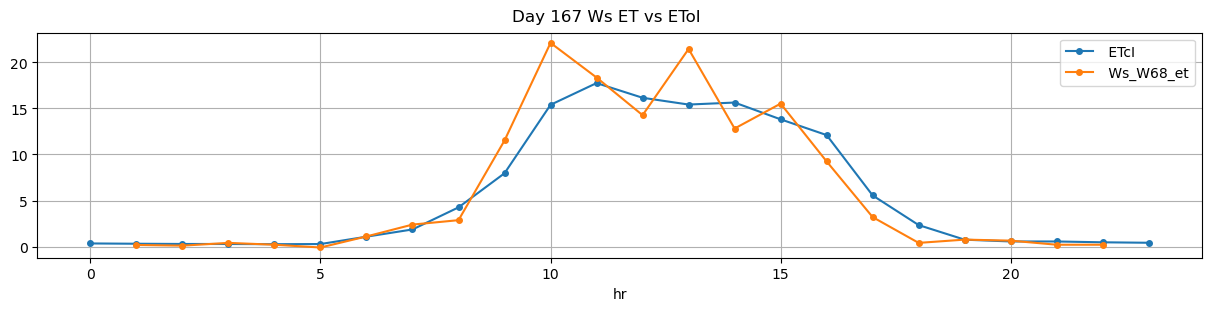
167 |
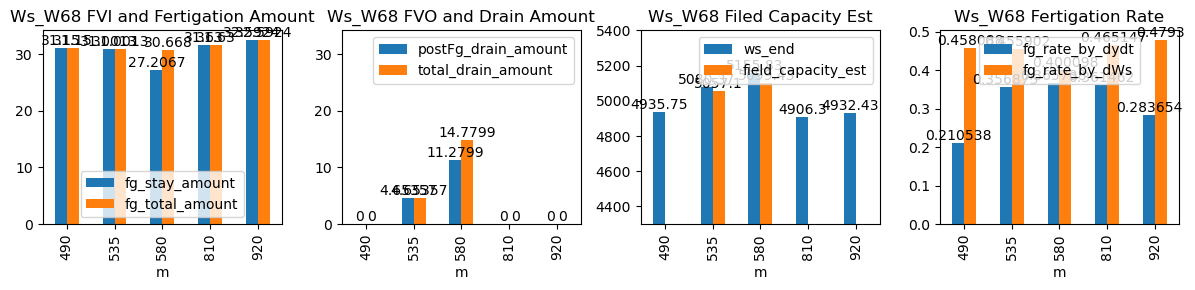
490 |
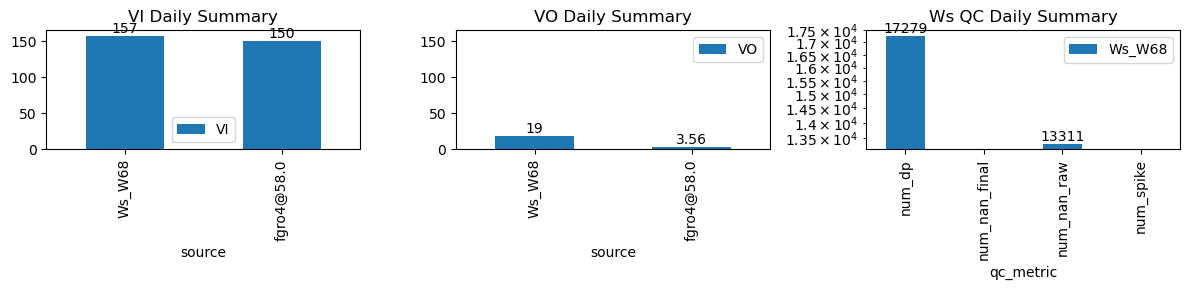
Ws_W68 |
0.456325 |
30 |
490.0 |
490.250000 |
491.13 |
496.000000 |
4780.000000 |
4935.750000 |
68 |
-0.023662 |
-0.004002 |
-0.046228 |
0.210538 |
0.458088 |
31.150000 |
True |
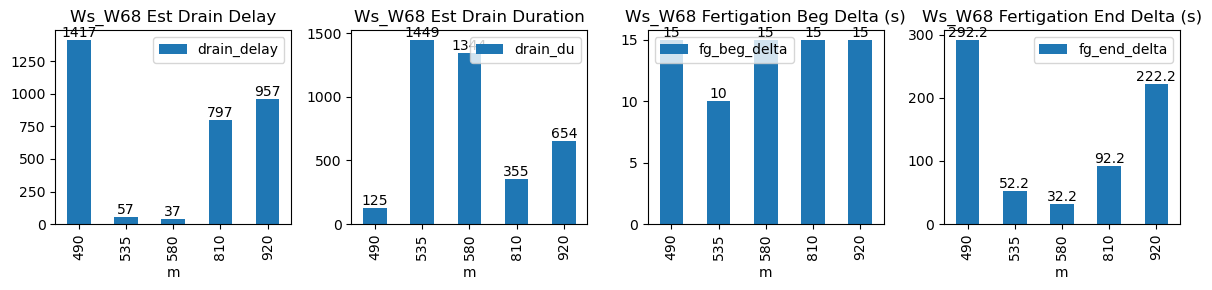
15.0 |
292.2 |
31.150000 |
0.0 |
0.000000 |
0.000000 |
125 |
1417 |
-0.010150 |
NaN |
| 2026-03-22 08:55:00+08:00 |
167 |
535 |
Ws_W68 |
0.456325 |
30 |
535.0 |
535.166667 |
536.13 |
537.000000 |
4925.360000 |
5080.366667 |
68 |
-0.047356 |
-0.121196 |
-0.094153 |
0.356875 |
0.455902 |
31.001333 |
True |
10.0 |
52.2 |
31.001333 |
0.0 |
4.653571 |
4.653571 |
1449 |
57 |
-0.088338 |
5057.098813 |
| 2026-03-22 09:40:00+08:00 |
167 |
580 |
Ws_W68 |
0.456325 |
30 |
580.0 |
580.250000 |
581.13 |
581.666667 |
5019.800000 |
5155.833333 |
68 |
-0.079174 |
-0.201558 |
-0.136399 |
0.365738 |
0.400098 |
27.206667 |
True |
15.0 |
32.2 |
30.668000 |
3.5 |
11.279931 |
14.779931 |
1344 |
37 |
-0.123203 |
5099.433679 |
| 2026-03-22 13:30:00+08:00 |
167 |
810 |
Ws_W68 |
0.456325 |
30 |
810.0 |
810.250000 |
811.13 |
812.666667 |
4748.150000 |
4906.300000 |
68 |
-0.201789 |
-0.145444 |
-0.070792 |
0.361462 |
0.465147 |
31.630000 |
True |
15.0 |
92.2 |
31.630000 |
0.0 |
0.000000 |
0.000000 |
355 |
797 |
-0.072636 |
NaN |
| 2026-03-22 15:20:00+08:00 |
167 |
920 |
Ws_W68 |
0.456325 |
30 |
920.0 |
920.250000 |
921.13 |
924.833333 |
4769.471429 |
4932.433333 |
68 |
-0.134629 |
-0.090868 |
-0.081988 |
0.283654 |
0.479300 |
32.592381 |
True |
15.0 |
222.2 |
32.592381 |
0.0 |
0.000000 |
0.000000 |
654 |
957 |
-0.024936 |
NaN |