| 2025-11-17 07:10:00+08:00 |
42 |
430 |
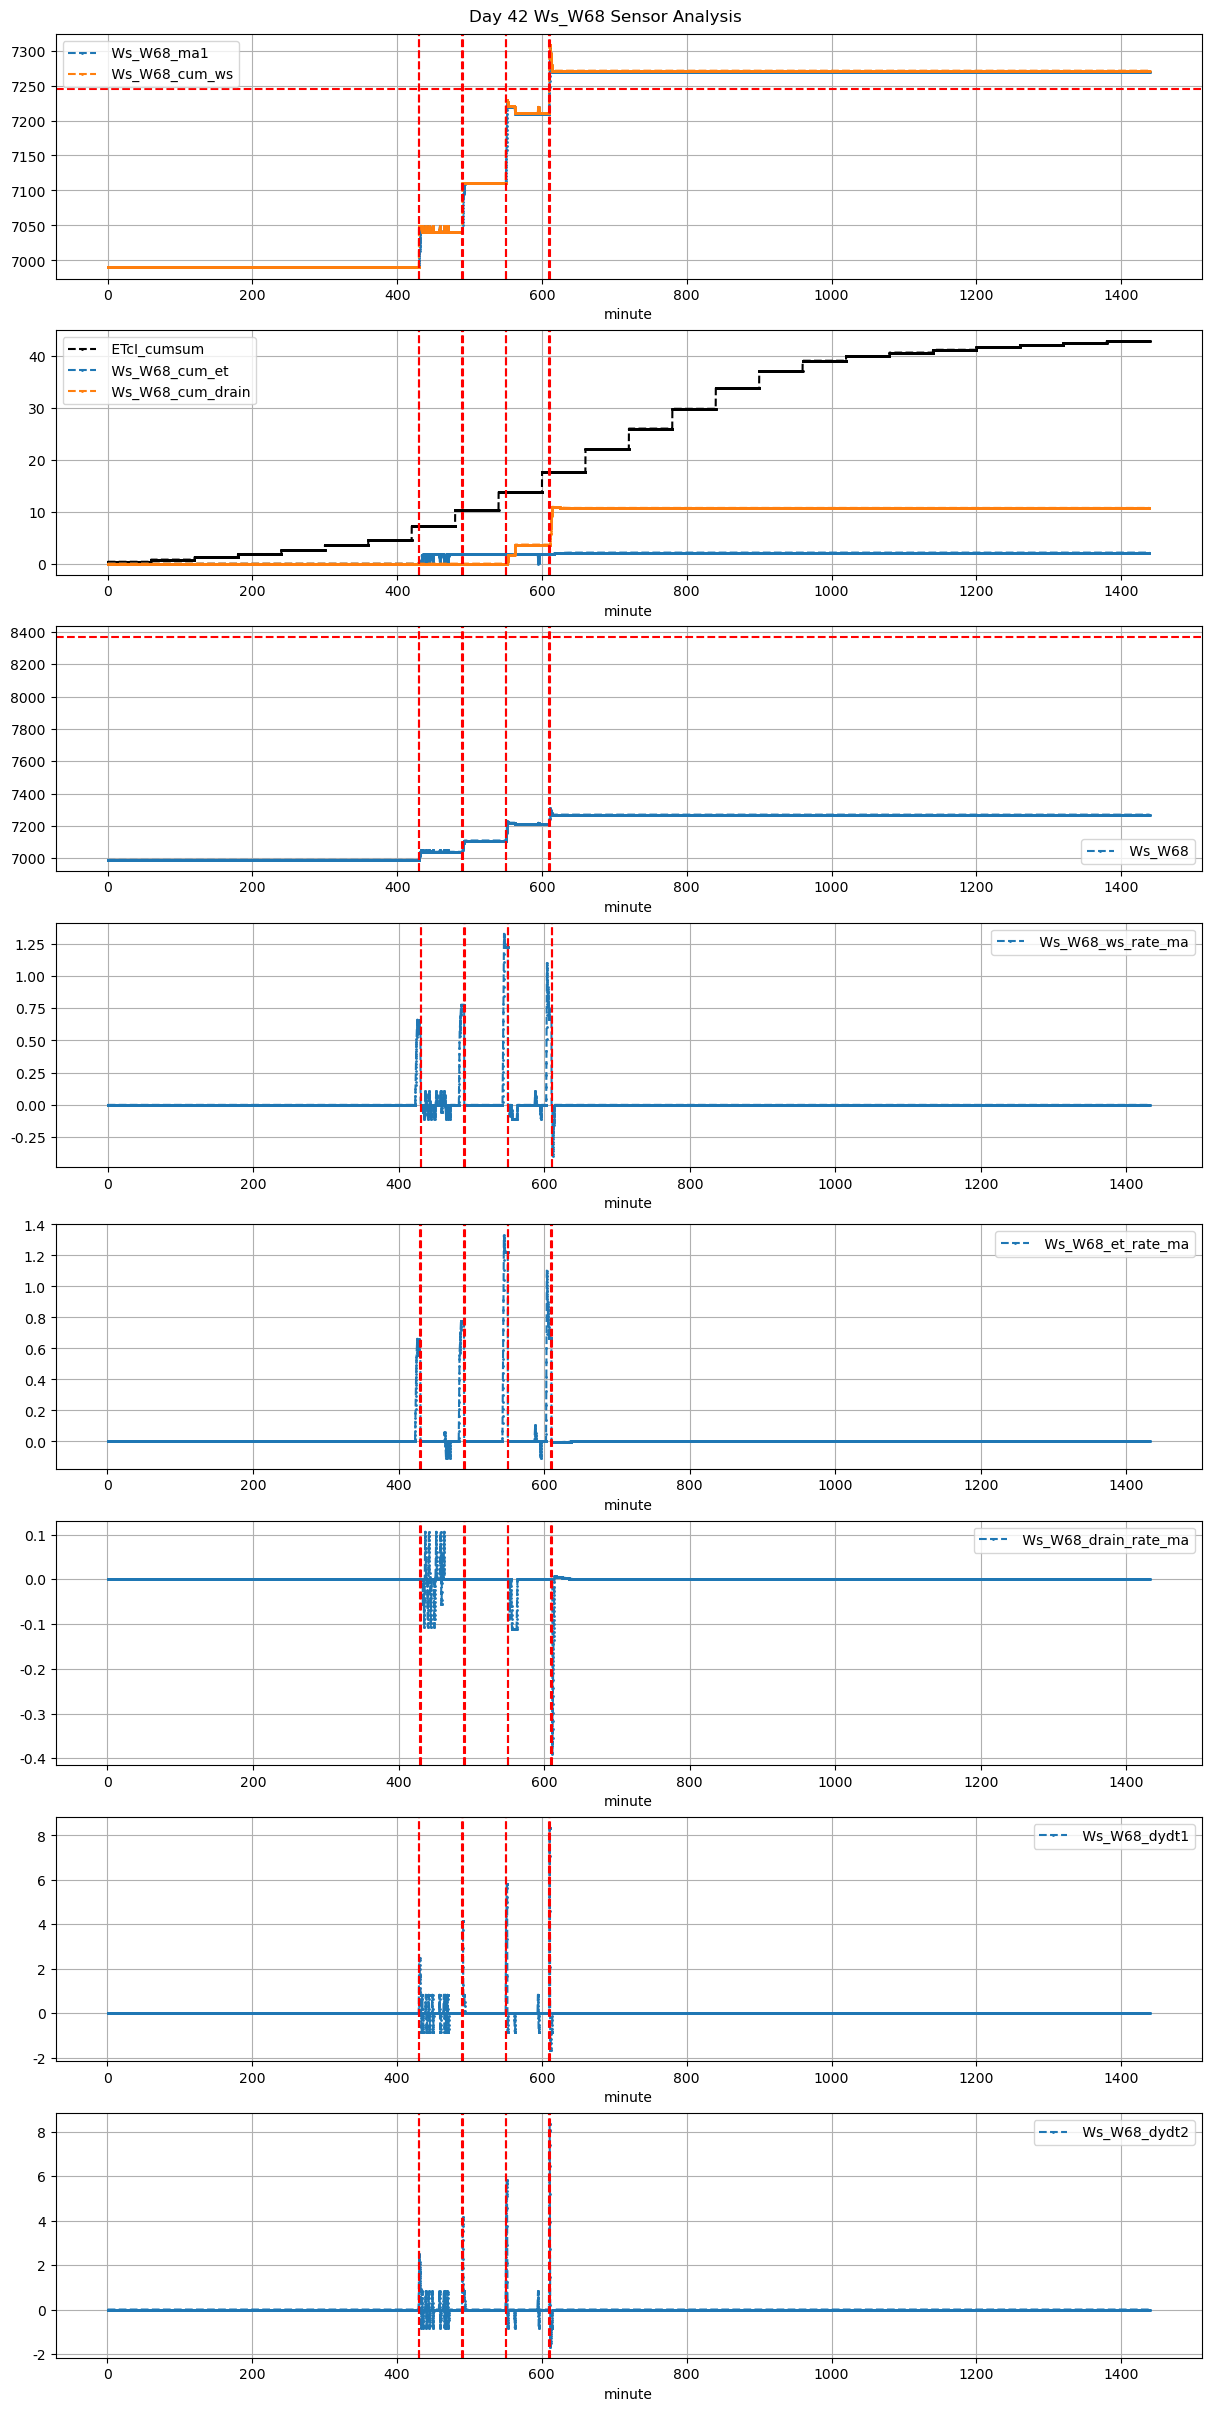
Ws_W68 |
1.692621 |
30 |
430.0 |
430.083333 |
430.7 |
433.083333 |
6990.0 |
7049.166667 |
42 |
0.000000 |
-0.018364 |
0.0 |
0.088750 |
0.281746 |
11.833333 |
True |
5.0 |
143.0 |
19.534884 |
0.0 |
0.000000 |
0.000000 |
50.0 |
262.0 |
-0.106481 |
NaN |
| 2025-11-17 08:10:00+08:00 |
42 |
490 |
Ws_W68 |
1.692621 |
30 |
490.0 |
490.083333 |
490.7 |
493.250000 |
7040.0 |
7110.000000 |
42 |
0.000000 |
0.000000 |
0.0 |
0.129167 |
0.333333 |
14.000000 |
True |
5.0 |
153.0 |
19.534884 |
0.0 |
0.000000 |
0.000000 |
NaN |
NaN |
NaN |
NaN |
| 2025-11-17 09:10:00+08:00 |
42 |
550 |
Ws_W68 |
1.692621 |
30 |
550.0 |
550.083333 |
550.7 |
552.250000 |
7110.0 |
7228.750000 |
42 |
0.000000 |
-0.074126 |
0.0 |
0.219167 |
0.565476 |
23.750000 |
True |
5.0 |
93.0 |
23.750000 |
0.0 |
1.979167 |
1.979167 |
439.0 |
307.0 |
-0.111111 |
7218.854167 |
| 2025-11-17 10:10:00+08:00 |
42 |
610 |
Ws_W68 |
1.692621 |
30 |
610.0 |
610.083333 |
610.7 |
611.250000 |
7210.0 |
7307.500000 |
42 |
-0.007491 |
-0.069239 |
0.0 |
0.321250 |
0.464286 |
19.500000 |
True |
5.0 |
33.0 |
19.534884 |
0.0 |
7.201547 |
7.201547 |
165.0 |
37.0 |
-0.361082 |
7271.492267 |