| 2025-11-23 08:40:00+08:00 |
48 |
520 |
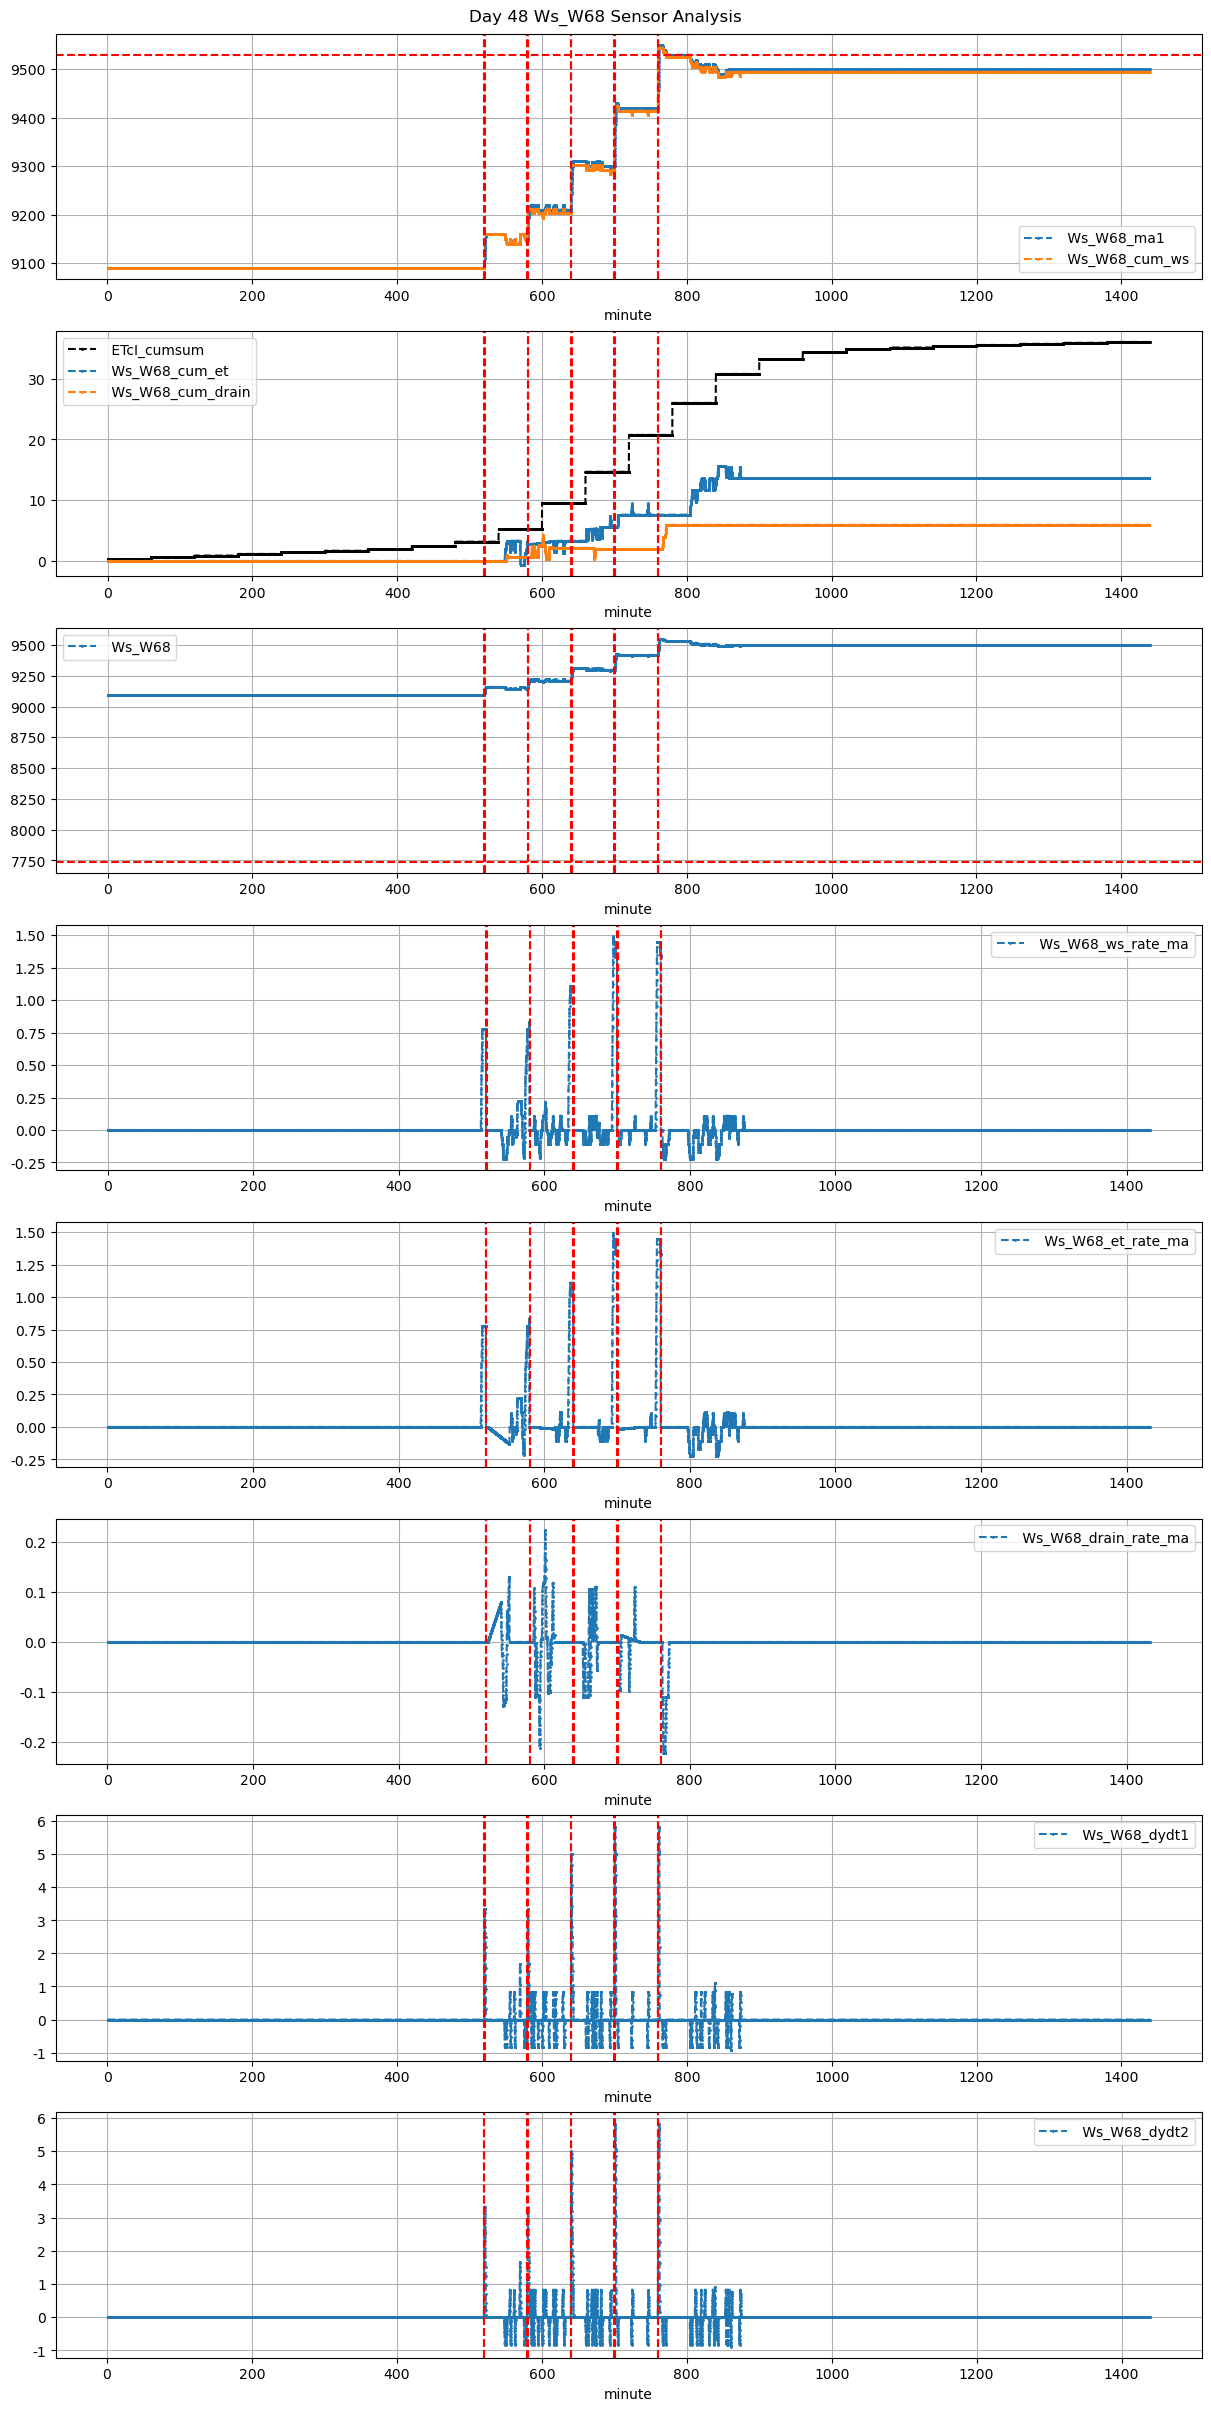
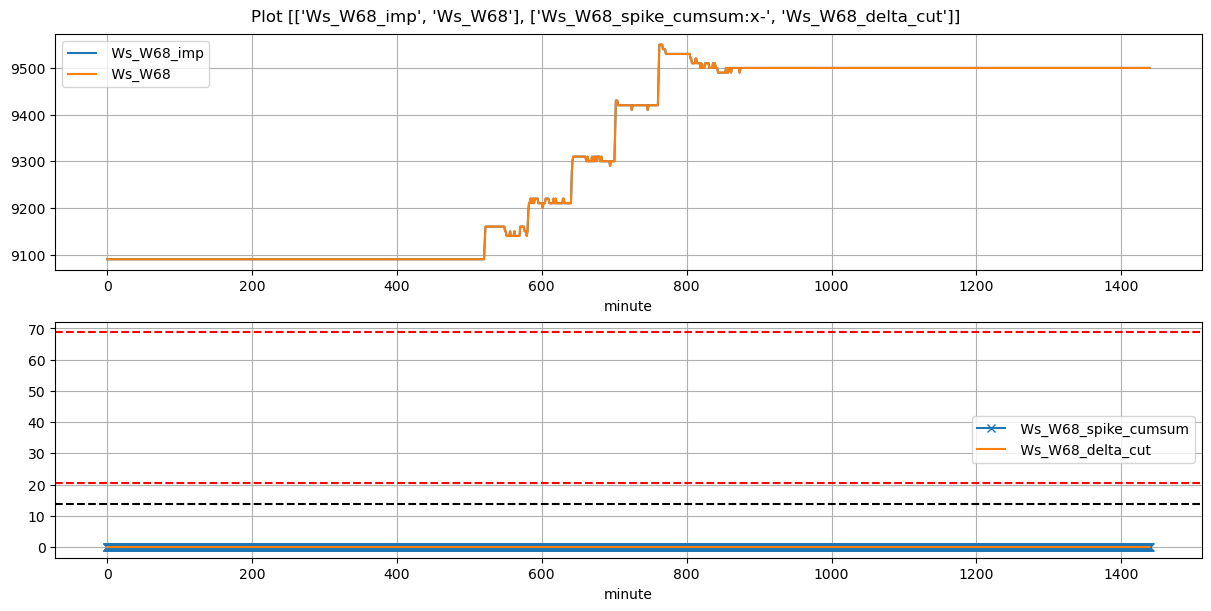
Ws_W68 |
1.350641 |
30 |
520.0 |
520.166667 |
520.75 |
522.416667 |
9090.0 |
9160.0 |
45 |
0.000000 |
0.000000 |
-0.130864 |
0.123333 |
0.311111 |
14.0 |
True |
10.0 |
100.0 |
24.165 |
0.0 |
0.000000 |
0.000000 |
285 |
1385 |
-0.127027 |
NaN |
| 2025-11-23 09:40:00+08:00 |
48 |
580 |
Ws_W68 |
1.350641 |
30 |
580.0 |
579.583333 |
580.75 |
584.416667 |
9150.0 |
9220.0 |
45 |
0.000000 |
-0.038272 |
-0.013580 |
0.093333 |
0.311111 |
14.0 |
True |
-25.0 |
220.0 |
24.165 |
0.0 |
0.000000 |
0.000000 |
110 |
759 |
-0.176385 |
NaN |
| 2025-11-23 10:40:00+08:00 |
48 |
640 |
Ws_W68 |
1.350641 |
30 |
640.0 |
640.166667 |
640.75 |
643.416667 |
9210.0 |
9310.0 |
45 |
-0.029963 |
0.000000 |
0.000000 |
0.162222 |
0.444444 |
20.0 |
True |
10.0 |
160.0 |
24.165 |
0.0 |
0.000000 |
0.000000 |
435 |
785 |
-0.111111 |
NaN |
| 2025-11-23 11:40:00+08:00 |
48 |
700 |
Ws_W68 |
1.350641 |
30 |
700.0 |
700.166667 |
700.75 |
702.416667 |
9297.5 |
9430.0 |
45 |
-0.014981 |
-0.035802 |
0.000000 |
0.222593 |
0.588889 |
26.5 |
True |
10.0 |
100.0 |
26.500 |
0.0 |
0.000000 |
0.000000 |
60 |
210 |
-0.097019 |
NaN |
| 2025-11-23 12:40:00+08:00 |
48 |
760 |
Ws_W68 |
1.350641 |
30 |
760.0 |
760.166667 |
760.75 |
762.416667 |
9420.0 |
9550.0 |
45 |
0.000000 |
-0.162963 |
0.000000 |
0.222593 |
0.577778 |
26.0 |
True |
10.0 |
100.0 |
26.000 |
0.0 |
3.979167 |
3.979167 |
450 |
185 |
-0.222222 |
9530.104167 |