| 2025-12-14 10:40:00+08:00 |
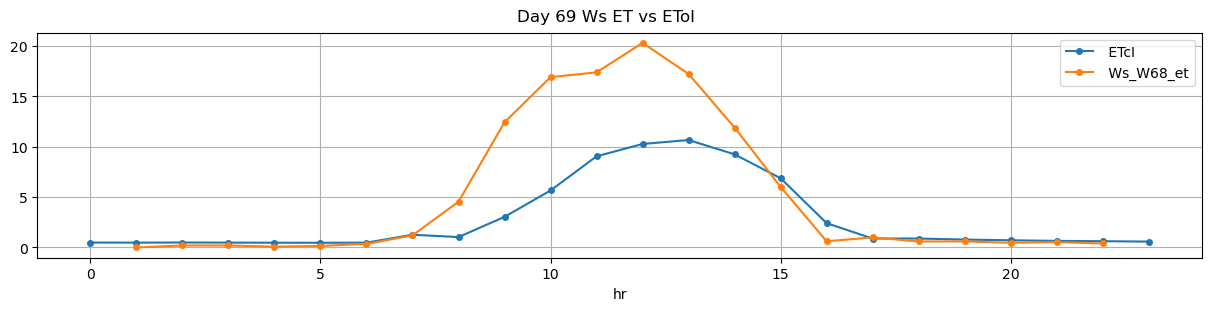
69 |
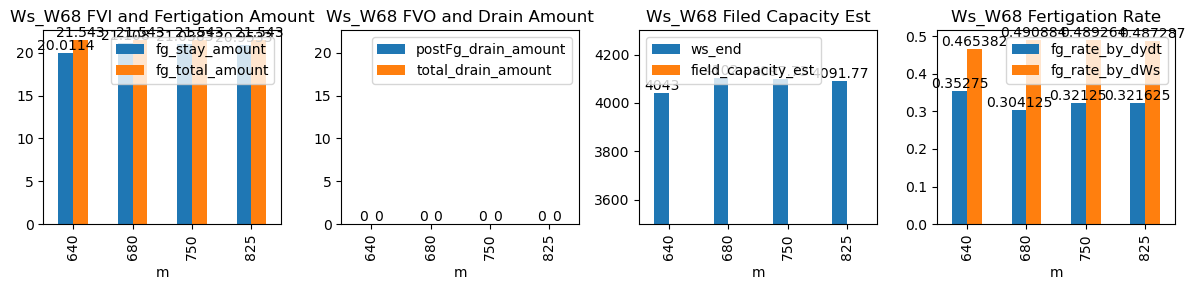
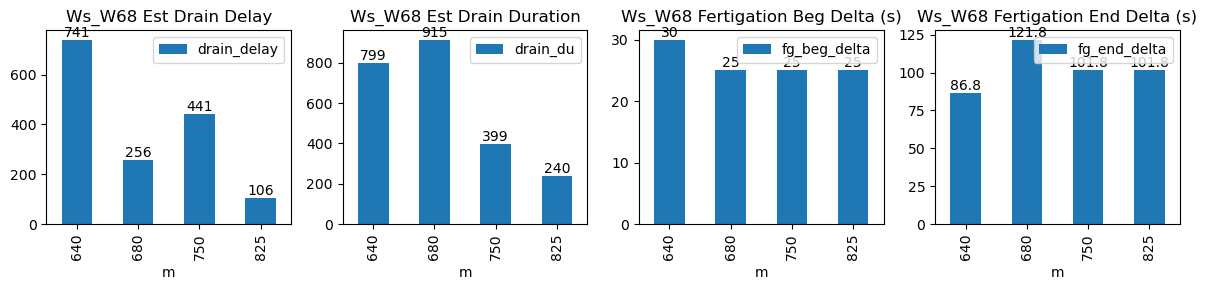
640 |
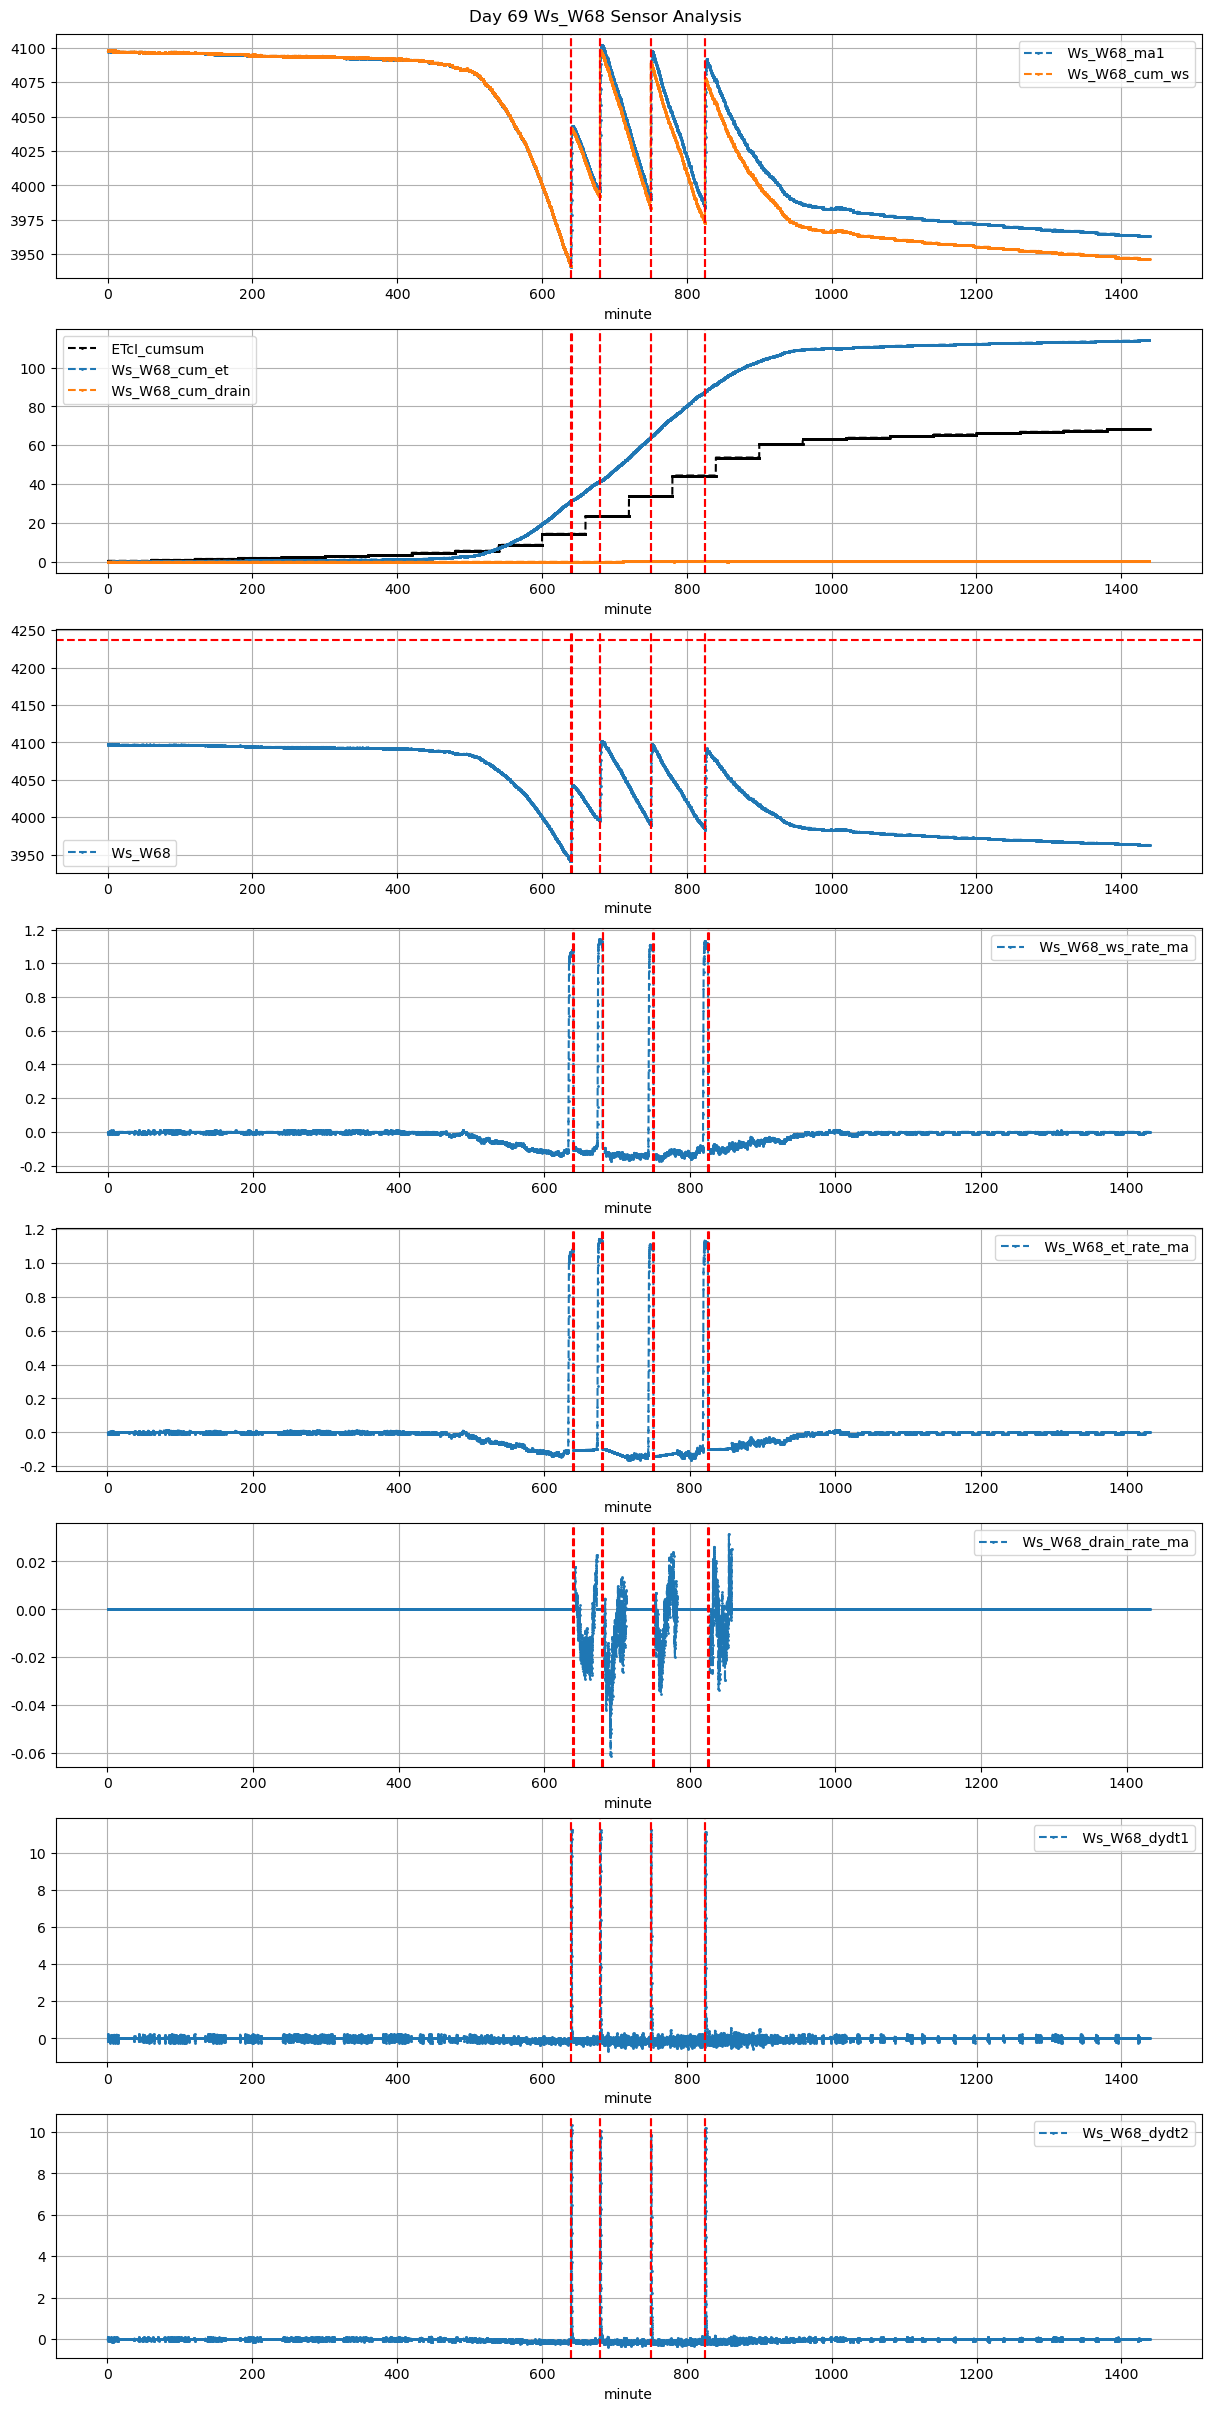
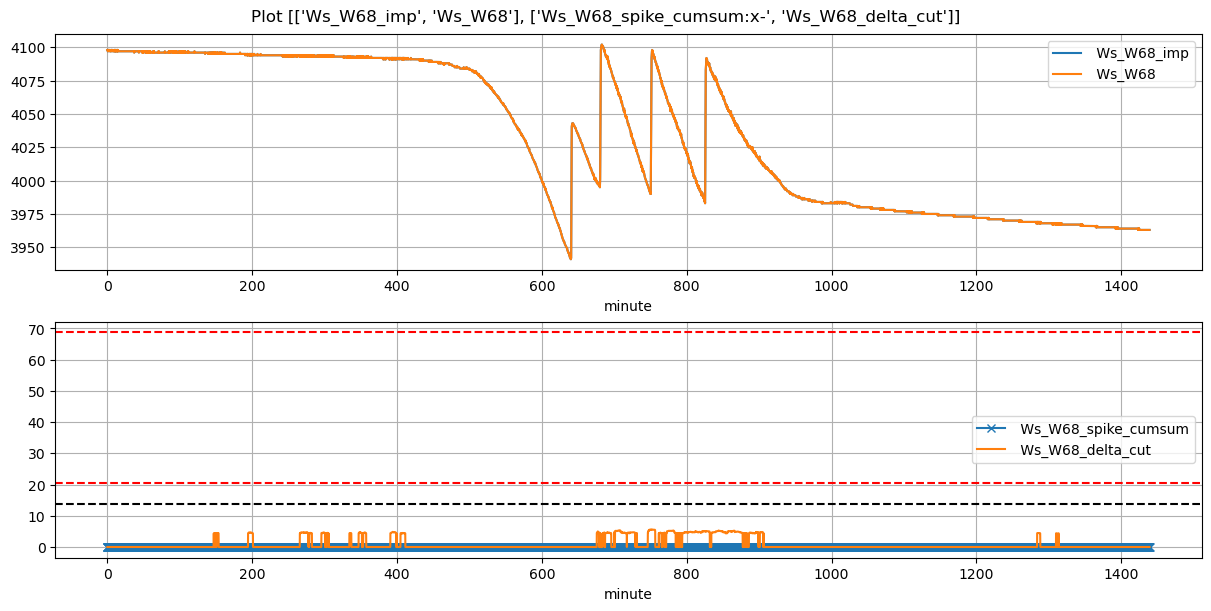
Ws_W68 |
0.302298 |
30 |
640.0 |
640.500000 |
640.72 |
642.166667 |
3942.942857 |
4043.000000 |
43 |
-0.117194 |
-0.106481 |
-0.100326 |
0.352750 |
0.465382 |
20.011429 |
True |
30.0 |
86.8 |
21.543 |
0.0 |
0 |
0.0 |
799 |
741 |
-0.025493 |
NaN |
| 2025-12-14 11:20:00+08:00 |
69 |
680 |
Ws_W68 |
0.302298 |
30 |
680.0 |
680.416667 |
680.72 |
682.750000 |
3996.460000 |
4102.000000 |
43 |
-0.097300 |
-0.127601 |
-0.145637 |
0.304125 |
0.490884 |
21.108000 |
True |
25.0 |
121.8 |
21.543 |
0.0 |
0 |
0.0 |
915 |
256 |
-0.038943 |
NaN |
| 2025-12-14 12:30:00+08:00 |
69 |
750 |
Ws_W68 |
0.302298 |
30 |
750.0 |
750.416667 |
750.72 |
752.416667 |
3992.533333 |
4097.725000 |
43 |
-0.140877 |
-0.151947 |
-0.120706 |
0.321250 |
0.489264 |
21.038333 |
True |
25.0 |
101.8 |
21.543 |
0.0 |
0 |
0.0 |
399 |
441 |
-0.030965 |
NaN |
| 2025-12-14 13:45:00+08:00 |
69 |
825 |
Ws_W68 |
0.302298 |
30 |
825.0 |
825.416667 |
825.72 |
827.416667 |
3987.000000 |
4091.766667 |
43 |
-0.101614 |
-0.101261 |
-0.094024 |
0.321625 |
0.487287 |
20.953333 |
True |
25.0 |
101.8 |
21.543 |
0.0 |
0 |
0.0 |
240 |
106 |
-0.025350 |
NaN |