| 2026-03-30 07:37:22+08:00 |
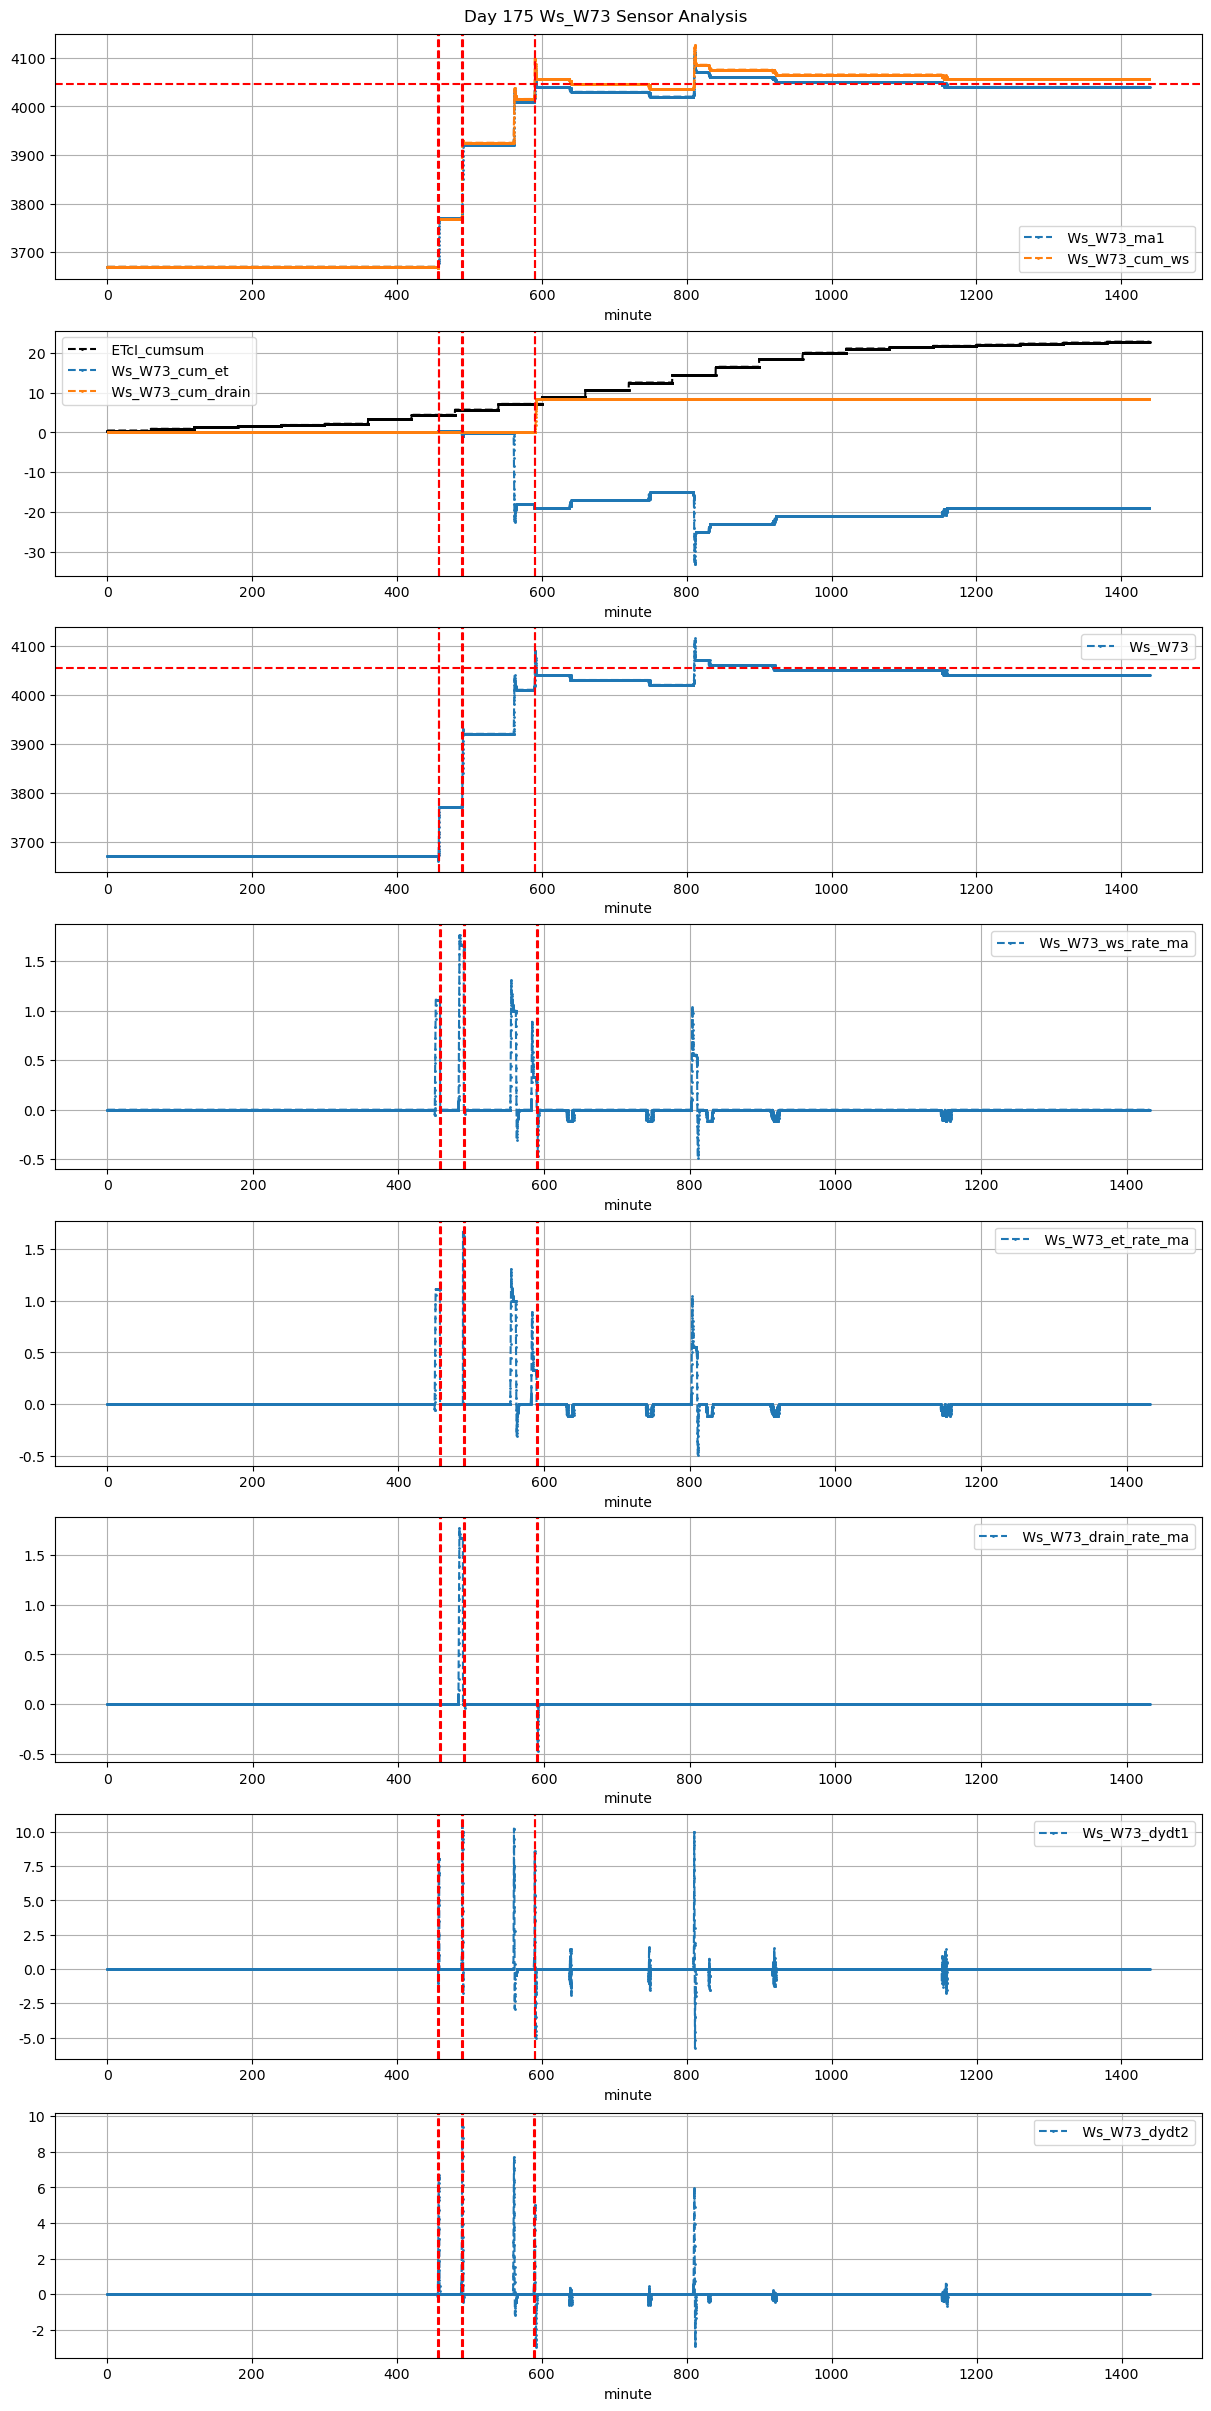
175 |
457 |
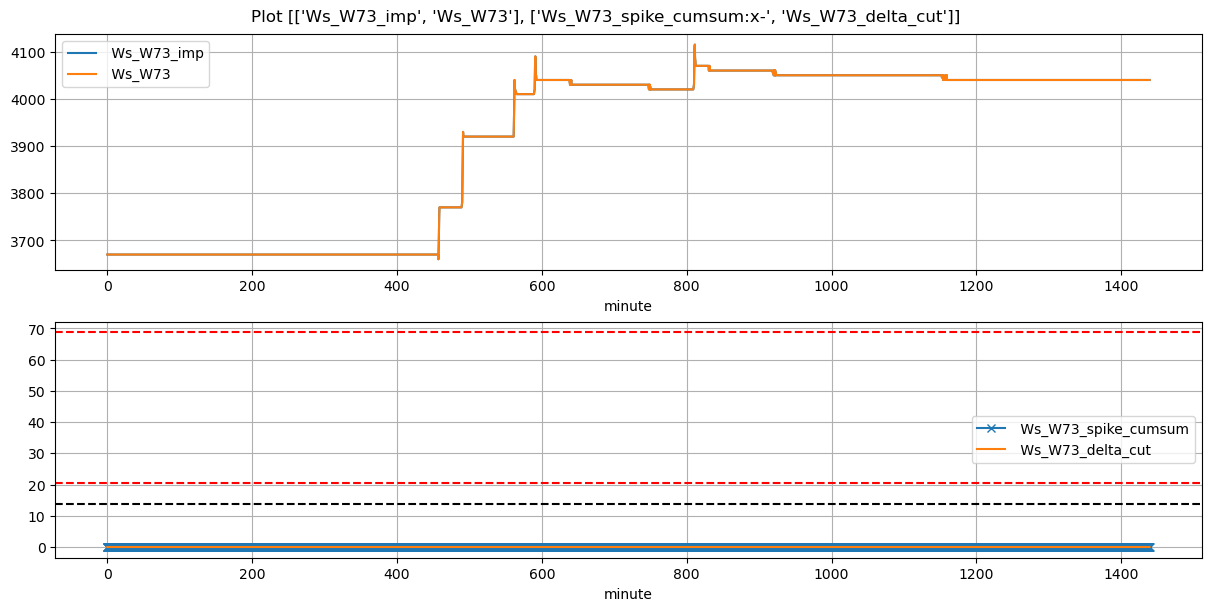
Ws_W73 |
1.970209 |
30 |
457.37 |
457.166667 |
458.54 |
458.666667 |
3670.0 |
3770.0 |
70 |
-0.000624 |
0.000000 |
0.0 |
0.252619 |
0.285714 |
20.0 |
True |
-12.2 |
7.6 |
26.53 |
0.00 |
0.00 |
0.00 |
NaN |
NaN |
NaN |
NaN |
| 2026-03-30 08:10:00+08:00 |
175 |
490 |
Ws_W73 |
1.970209 |
30 |
490.00 |
489.666667 |
491.18 |
491.416667 |
3770.0 |
3925.0 |
71 |
-0.009013 |
-0.001389 |
0.0 |
0.346299 |
0.436620 |
31.0 |
True |
-20.0 |
14.2 |
31.00 |
0.00 |
0.00 |
0.00 |
10.0 |
19.0 |
-0.038893 |
NaN |
| 2026-03-30 09:50:01+08:00 |
175 |
590 |
Ws_W73 |
1.970209 |
30 |
590.02 |
589.666667 |
591.19 |
591.000000 |
4010.0 |
4087.0 |
70 |
0.000000 |
-0.032407 |
0.0 |
0.191905 |
0.220000 |
15.4 |
True |
-21.2 |
-11.4 |
26.53 |
4.18 |
8.36 |
12.54 |
80.0 |
3.0 |
-0.430556 |
4045.2 |