| 2026-03-25 09:21:11+08:00 |
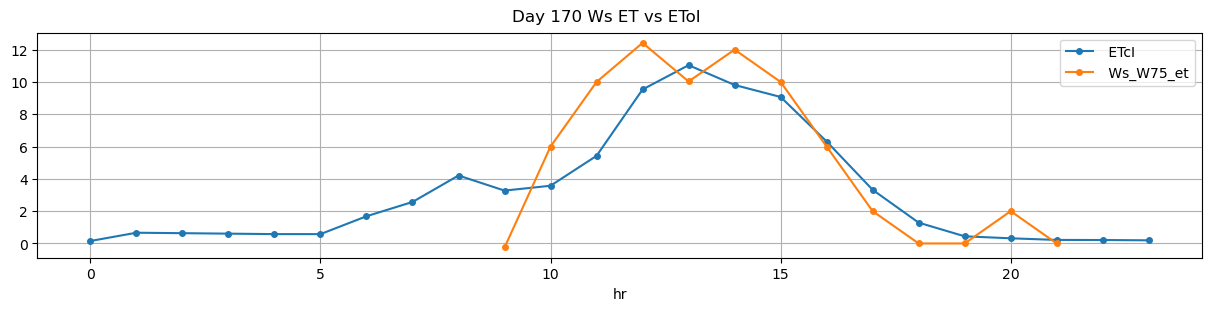
170 |
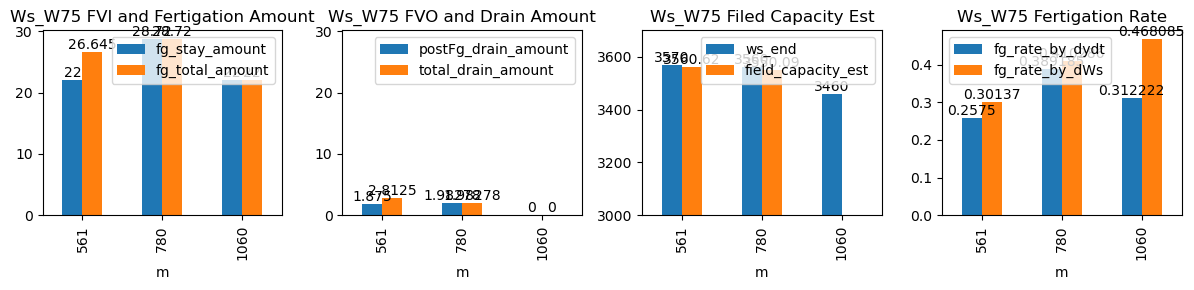
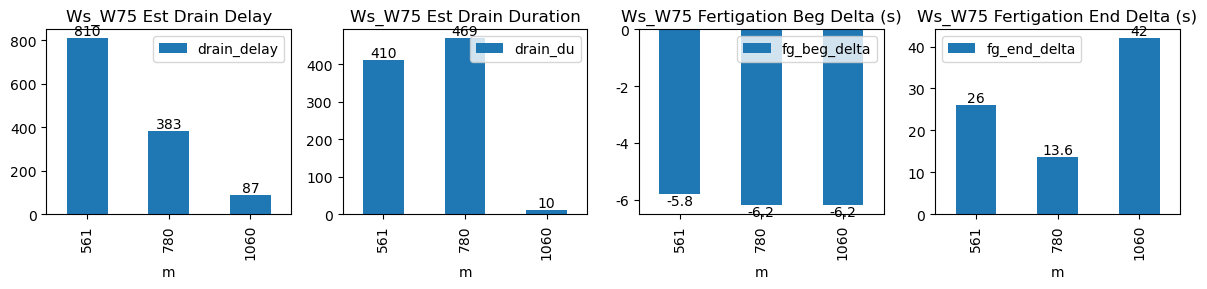
561 |
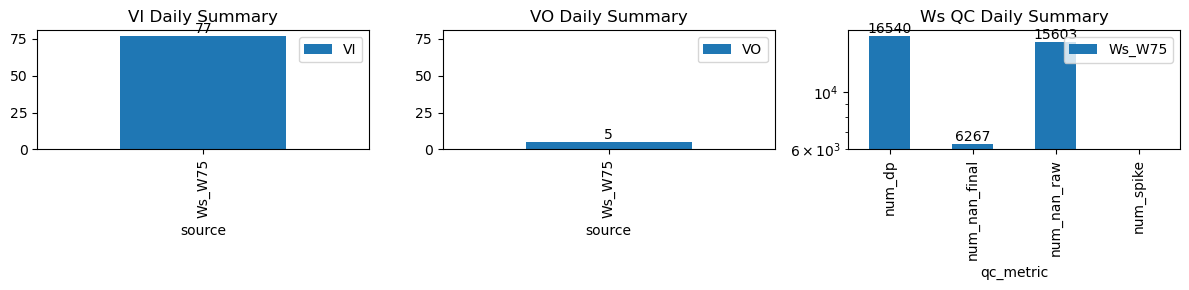
Ws_W75 |
0.865876 |
30 |
561.18 |
561.083333 |
562.40 |
562.666667 |
3460.000000 |
3570.0 |
73 |
0.00000 |
0.000000 |
0.0 |
0.259444 |
0.301370 |
22.000000 |
True |
-5.8 |
16.0 |
26.645000 |
0.0 |
0 |
0.0 |
15 |
1215 |
-1.931250e+00 |
NaN |
| 2026-03-25 13:00:01+08:00 |
170 |
780 |
Ws_W75 |
0.865876 |
30 |
780.02 |
779.916667 |
781.19 |
781.250000 |
3413.733333 |
3560.0 |
70 |
-0.04209 |
-0.104167 |
0.0 |
0.389481 |
0.417905 |
29.253333 |
True |
-6.2 |
3.6 |
29.253333 |
0.0 |
0 |
0.0 |
20 |
1453 |
-1.227442e+00 |
NaN |
| 2026-03-25 17:40:01+08:00 |
170 |
1060 |
Ws_W75 |
0.865876 |
30 |
1060.02 |
1059.916667 |
1060.80 |
1061.083333 |
3350.000000 |
3460.0 |
47 |
0.00000 |
0.000000 |
0.0 |
0.327778 |
0.468085 |
22.000000 |
True |
-6.2 |
17.0 |
22.000000 |
0.0 |
0 |
0.0 |
5 |
46 |
-2.273737e-13 |
NaN |