| 2026-02-25 11:35:01+08:00 |
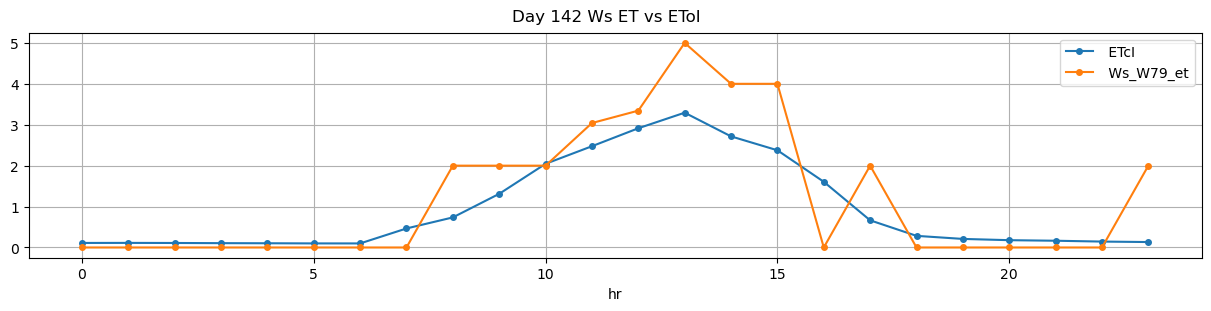
142 |
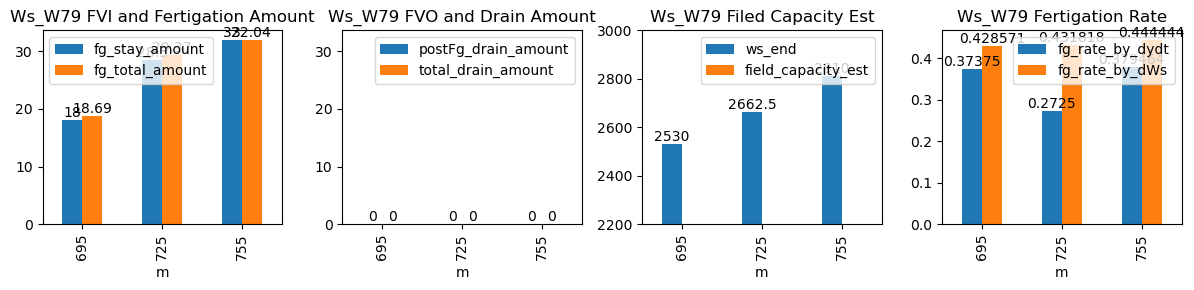
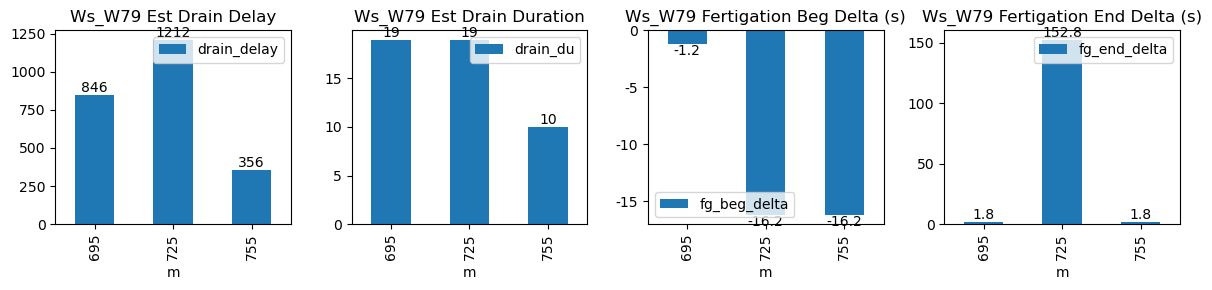
695 |
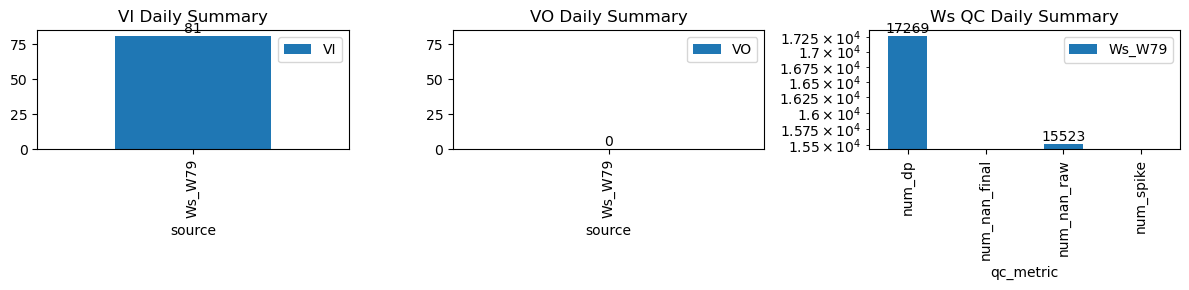
Ws_W79 |
1.60248 |
29.250000 |
695.02 |
695.00 |
695.72 |
695.750000 |
2436.5 |
2530.0 |
42 |
-0.025188 |
0.000000 |
0.0 |
0.377500 |
0.445238 |
18.7 |
True |
-1.2 |
1.8 |
18.7 |
0.0 |
0 |
0.0 |
19 |
846 |
-2.187500 |
NaN |
| 2026-02-25 12:05:01+08:00 |
142 |
725 |
Ws_W79 |
1.60248 |
26.333333 |
725.02 |
724.75 |
726.12 |
728.666667 |
2520.0 |
2670.0 |
66 |
0.000000 |
-0.002778 |
0.0 |
0.270000 |
0.454545 |
30.0 |
True |
-16.2 |
152.8 |
30.0 |
0.0 |
0 |
0.0 |
19 |
1212 |
-2.005414 |
NaN |
| 2026-02-25 12:35:01+08:00 |
142 |
755 |
Ws_W79 |
1.60248 |
30.000000 |
755.02 |
754.75 |
756.22 |
756.250000 |
2650.0 |
2810.0 |
72 |
-0.012510 |
-0.130556 |
0.0 |
0.385179 |
0.444444 |
32.0 |
True |
-16.2 |
1.8 |
32.0 |
0.0 |
0 |
0.0 |
10 |
356 |
-2.189505 |
NaN |