| 2026-03-08 08:05:01+08:00 |
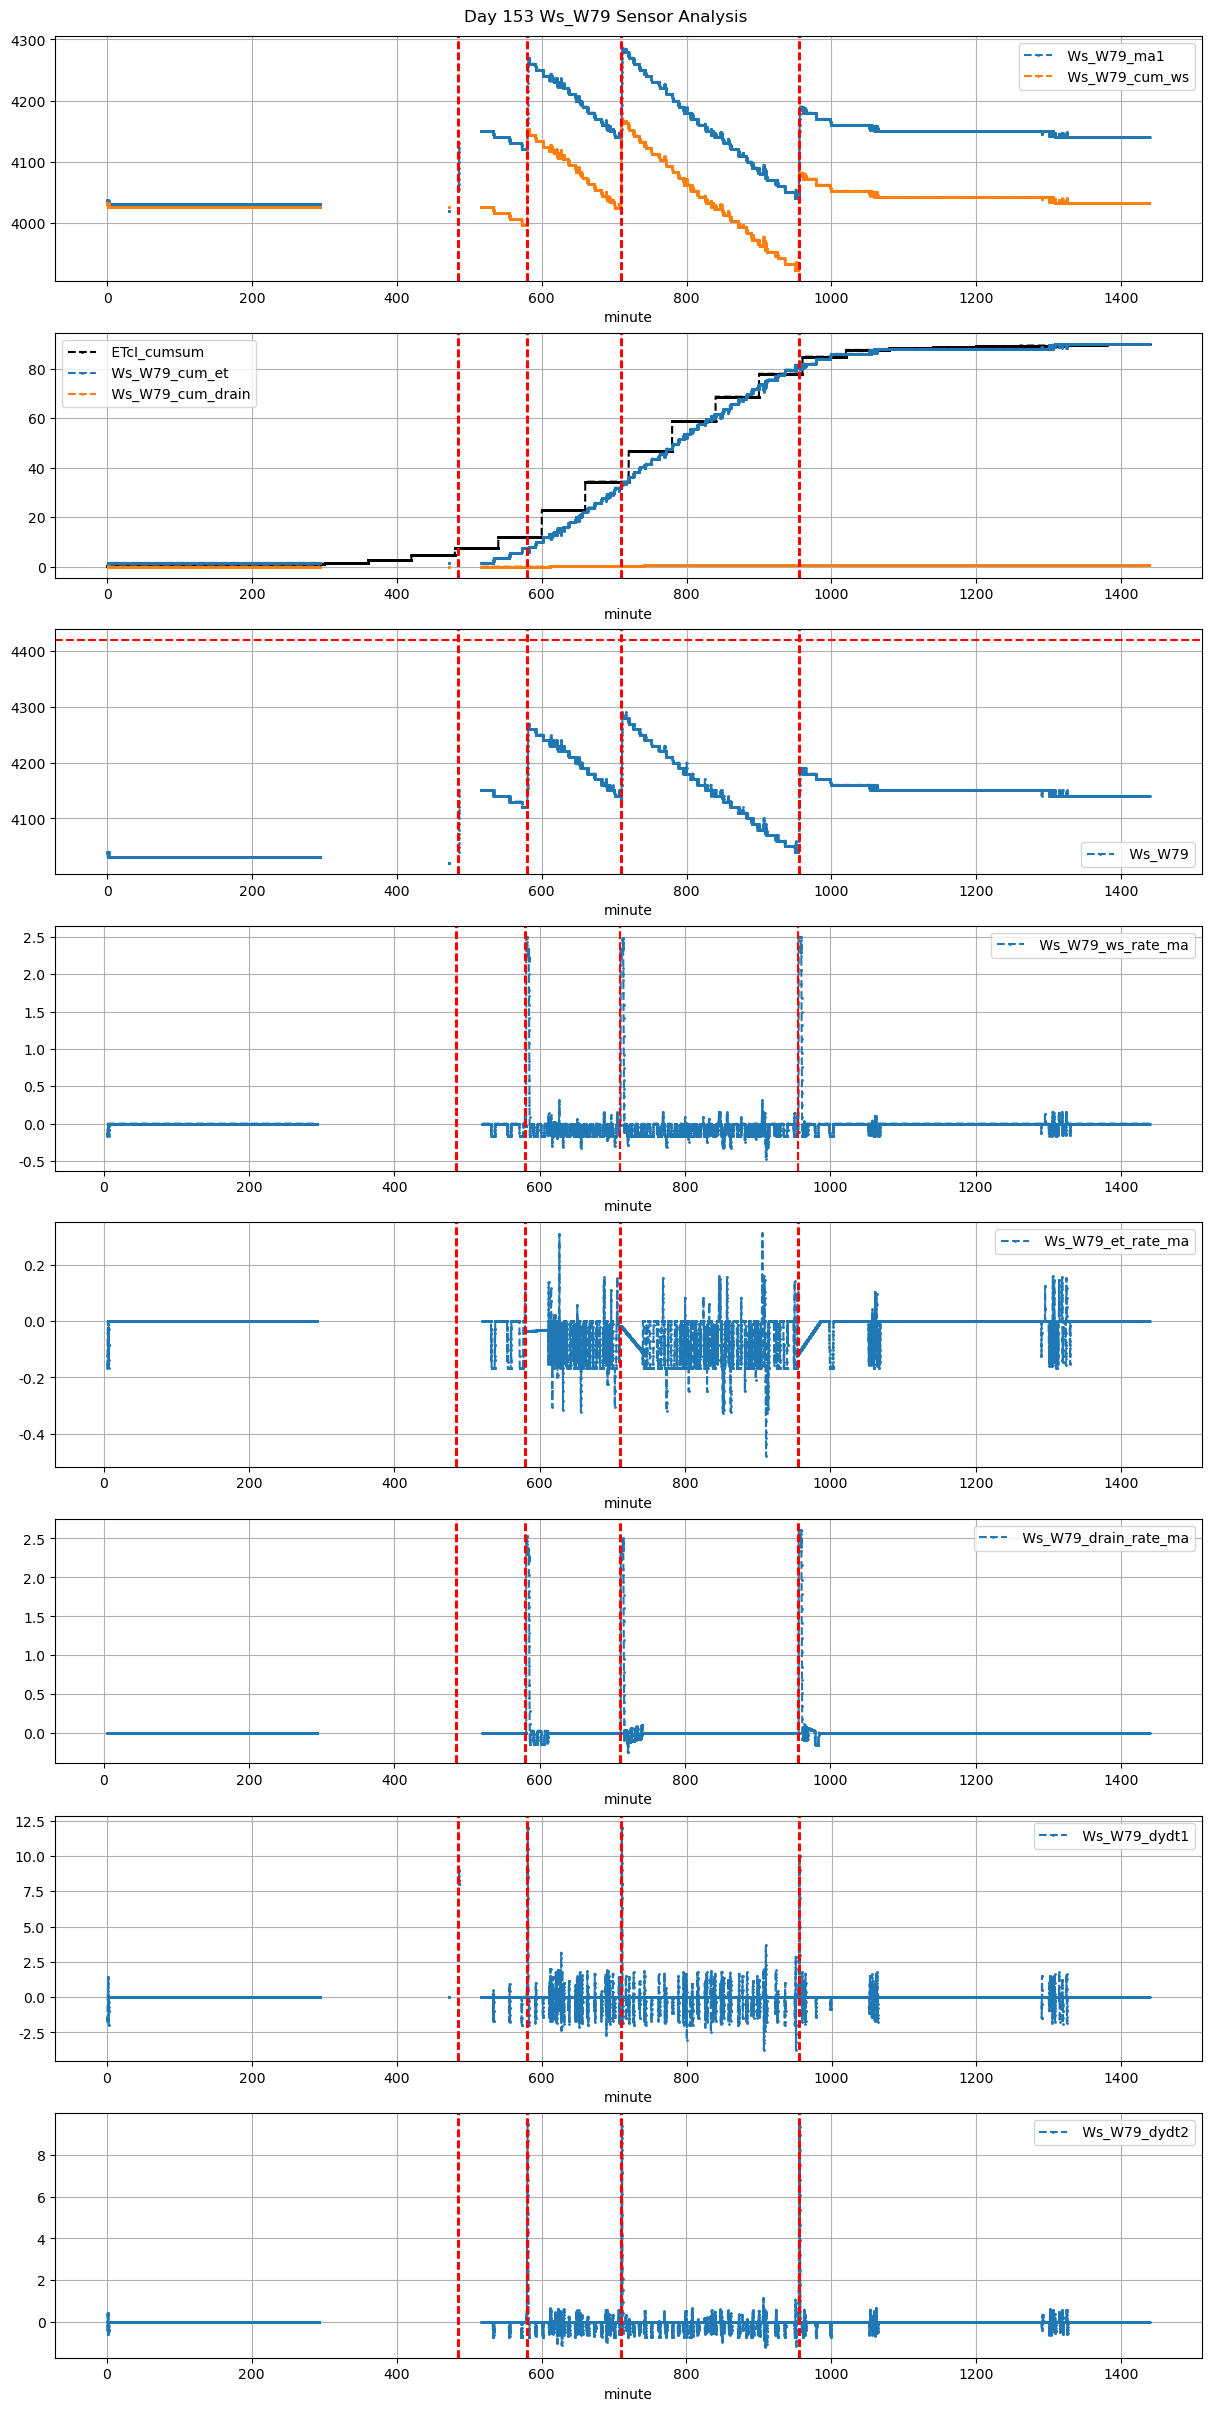
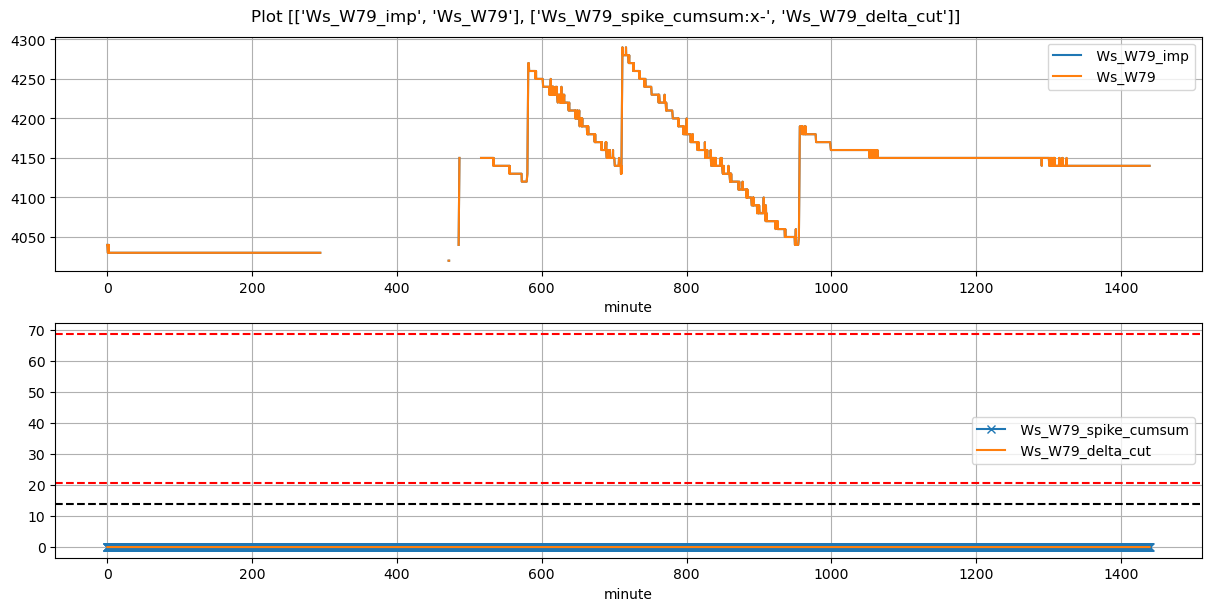
153 |
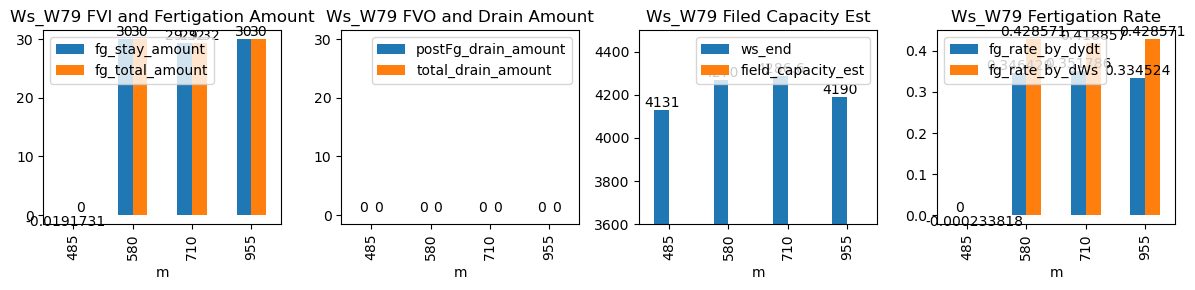
485 |
Ws_W79 |
1.214655 |
30 |
485.02 |
NaN |
486.39 |
486.333333 |
NaN |
4150.0 |
82 |
NaN |
NaN |
NaN |
NaN |
NaN |
NaN |
False |
NaN |
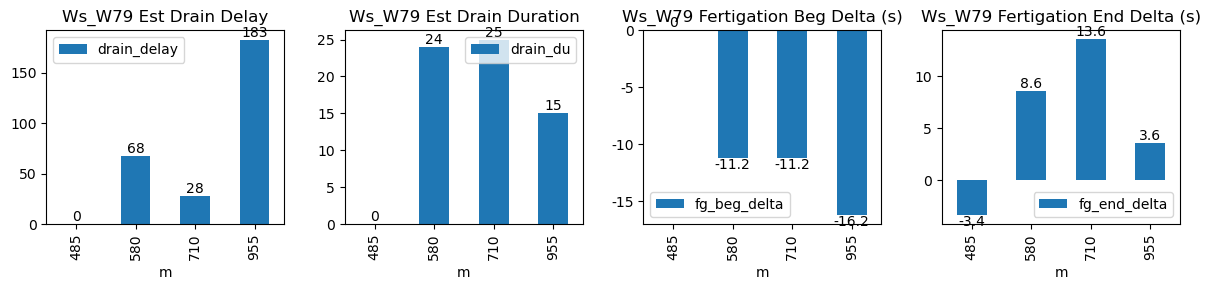
-3.4 |
NaN |
0.0 |
NaN |
NaN |
NaN |
NaN |
NaN |
NaN |
| 2026-03-08 09:40:01+08:00 |
153 |
580 |
Ws_W79 |
1.214655 |
30 |
580.02 |
579.833333 |
581.19 |
581.333333 |
4120.0 |
4270.0 |
70 |
-0.071563 |
-0.035694 |
-0.030556 |
0.351667 |
0.428571 |
30.0 |
True |
-11.2 |
8.6 |
30.0 |
0.0 |
0.0 |
0.0 |
24.0 |
68.0 |
-1.714490 |
NaN |
| 2026-03-08 11:50:01+08:00 |
153 |
710 |
Ws_W79 |
1.214655 |
30 |
710.02 |
709.833333 |
711.19 |
711.416667 |
4140.0 |
4290.0 |
70 |
-0.016596 |
-0.054861 |
-0.109259 |
0.353286 |
0.428571 |
30.0 |
True |
-11.2 |
13.6 |
30.0 |
0.0 |
0.0 |
0.0 |
25.0 |
28.0 |
-1.782630 |
NaN |
| 2026-03-08 15:55:01+08:00 |
153 |
955 |
Ws_W79 |
1.214655 |
30 |
955.02 |
954.750000 |
956.19 |
956.250000 |
4040.0 |
4190.0 |
70 |
-0.122411 |
-0.112500 |
0.000000 |
0.343571 |
0.428571 |
30.0 |
True |
-16.2 |
3.6 |
30.0 |
0.0 |
0.0 |
0.0 |
15.0 |
183.0 |
-1.584908 |
NaN |