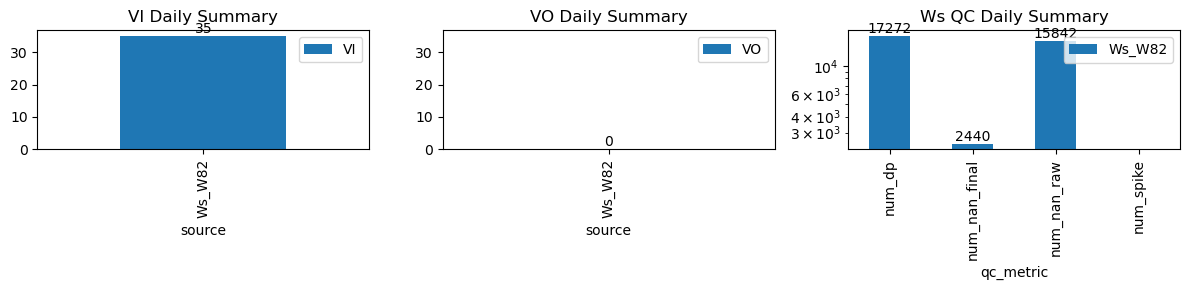
VI and VO Daily Summary
| ws_name | num_dp | num_nan_raw | num_nan_final | num_spike | cum_step_adj |
|---|---|---|---|---|---|
| Ws_W82 | 17,272 | 15,842 | 2,440 | 0 | 0.00 |
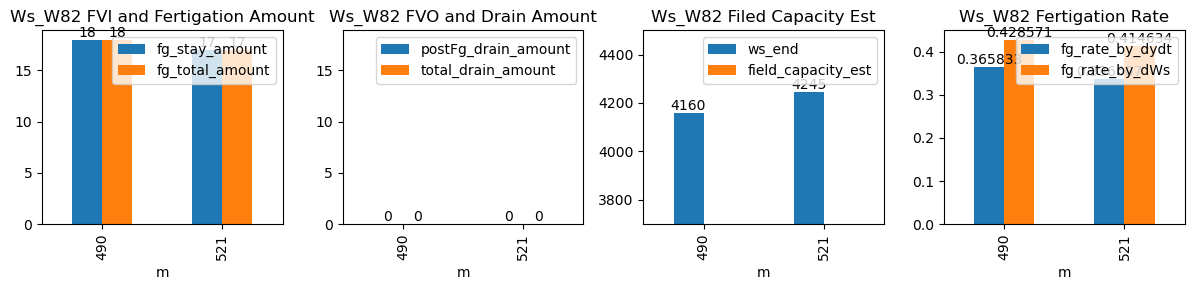
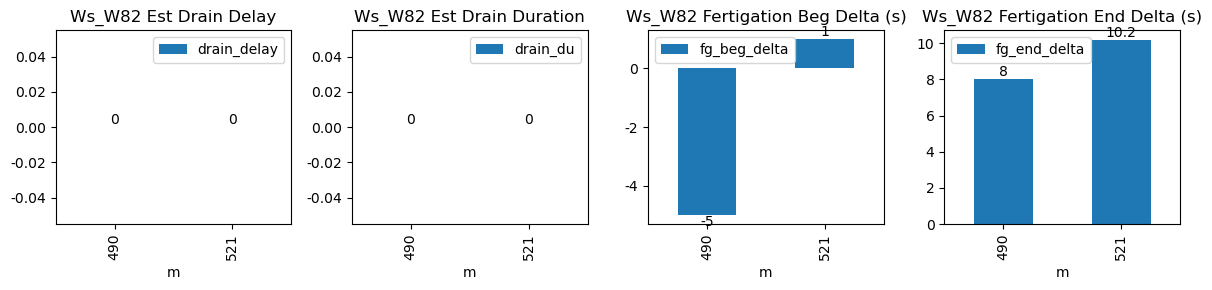
| ds | d | m | ws_name | prominence_cut | max_drain_du | fg_beg | fg_beg_est | fg_end | fg_end_est | ws_beg | ws_end | duc | pre_fg_et | post_fg_ws | post_drn_et | fg_rate_by_dydt | fg_rate_by_dWs | fg_stay_amount | enough_data | fg_beg_delta | fg_end_delta | fg_total_amount | fg_drain_amount | postFg_drain_amount | total_drain_amount | drain_du | drain_delay | drain_rate | field_capacity_est |
|---|---|---|---|---|---|---|---|---|---|---|---|---|---|---|---|---|---|---|---|---|---|---|---|---|---|---|---|---|---|
| 2026-03-04 08:10:00+08:00 | 149 | 490 | Ws_W82 | 1.717797 | 30 | 490.0 | 489.916667 | 490.70 | 490.833333 | 4070.0 | 4160.0 | 42 | 0.000000 | 0.000000 | 0.0 | 0.365833 | 0.428571 | 18.0 | True | -5.0 | 8.0 | 18.0 | 0.0 | 0 | 0.0 | NaN | NaN | NaN | NaN |
| 2026-03-04 08:41:24+08:00 | 149 | 521 | Ws_W82 | 1.717797 | 30 | 521.4 | 521.416667 | 522.08 | 522.250000 | 4160.0 | 4245.0 | 41 | -0.009286 | -0.021564 | 0.0 | 0.336607 | 0.414634 | 17.0 | True | 1.0 | 10.2 | 17.0 | 0.0 | 0 | 0.0 | NaN | NaN | NaN | NaN |