VI and VO Daily Summary
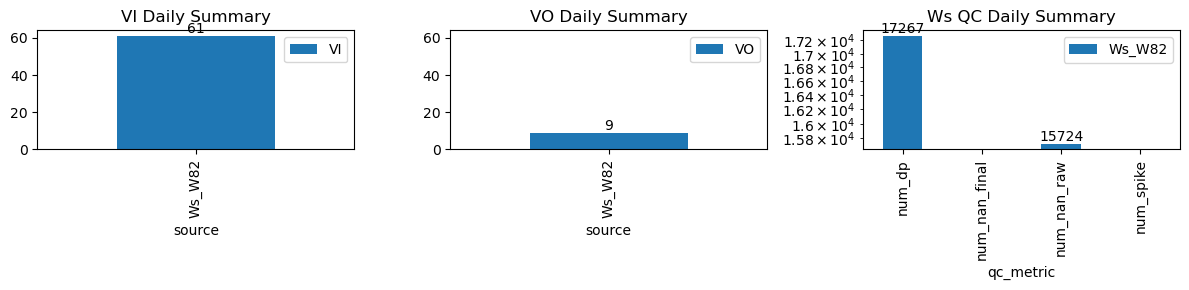
| ws_name | num_dp | num_nan_raw | num_nan_final | num_spike | cum_step_adj |
|---|---|---|---|---|---|
| Ws_W82 | 17,267 | 15,724 | 0 | 0 | 0.00 |
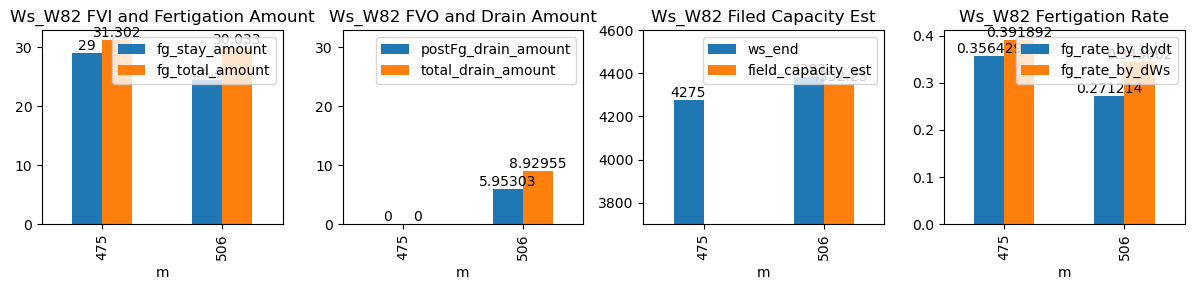
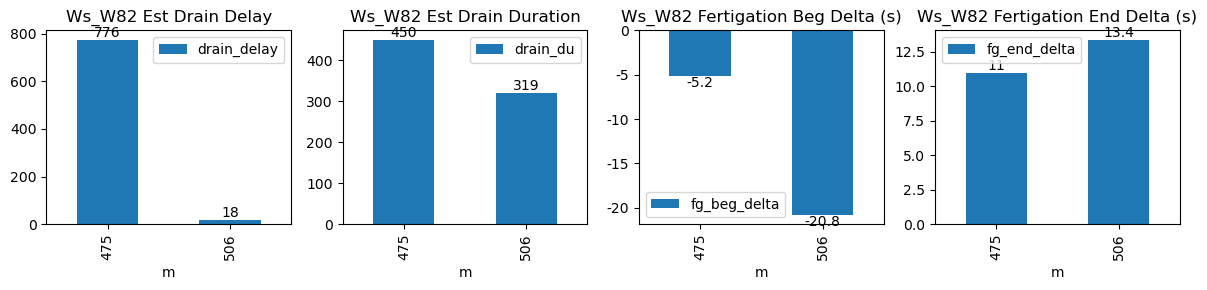
| ds | d | m | ws_name | prominence_cut | max_drain_du | fg_beg | fg_beg_est | fg_end | fg_end_est | ws_beg | ws_end | duc | pre_fg_et | post_fg_ws | post_drn_et | fg_rate_by_dydt | fg_rate_by_dWs | fg_stay_amount | enough_data | fg_beg_delta | fg_end_delta | fg_total_amount | fg_drain_amount | postFg_drain_amount | total_drain_amount | drain_du | drain_delay | drain_rate | field_capacity_est |
|---|---|---|---|---|---|---|---|---|---|---|---|---|---|---|---|---|---|---|---|---|---|---|---|---|---|---|---|---|---|
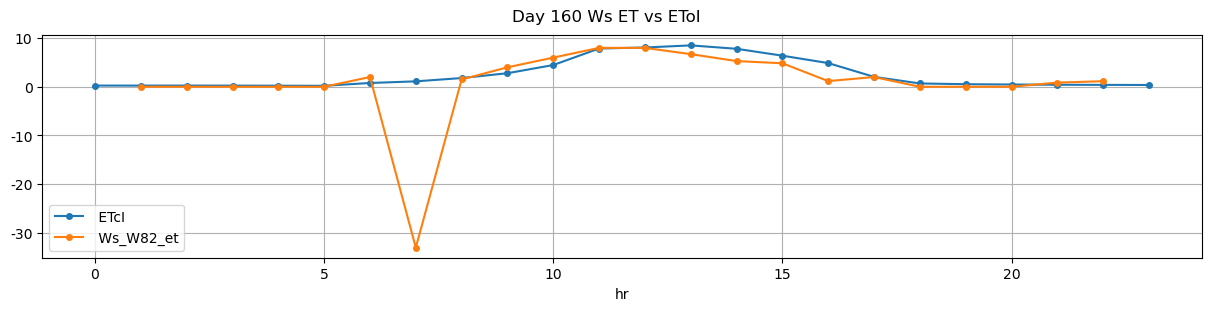
| 2026-03-15 07:55:40+08:00 | 160 | 475 | Ws_W82 | 1.308592 | 28.916667 | 475.67 | 475.583333 | 476.90 | 477.083333 | 4130.0 | 4275.0 | 74 | 0.000000 | -0.002469 | 0.0 | 0.356429 | 0.391892 | 29.0 | True | -5.2 | 11.0 | 31.302 | 0.000000 | 0.000000 | 0.000000 | 450 | 776 | -0.105413 | NaN |
| 2026-03-15 08:26:11+08:00 | 160 | 506 | Ws_W82 | 1.308592 | 30.000000 | 506.18 | 505.833333 | 507.36 | 507.583333 | 4260.0 | 4382.0 | 71 | -0.012449 | -0.093519 | 0.0 | 0.271214 | 0.343662 | 24.4 | True | -20.8 | 13.4 | 30.033 | 2.976517 | 5.953034 | 8.929551 | 319 | 18 | -0.199599 | 4352.234829 |