| 2026-04-07 08:45:00+08:00 |
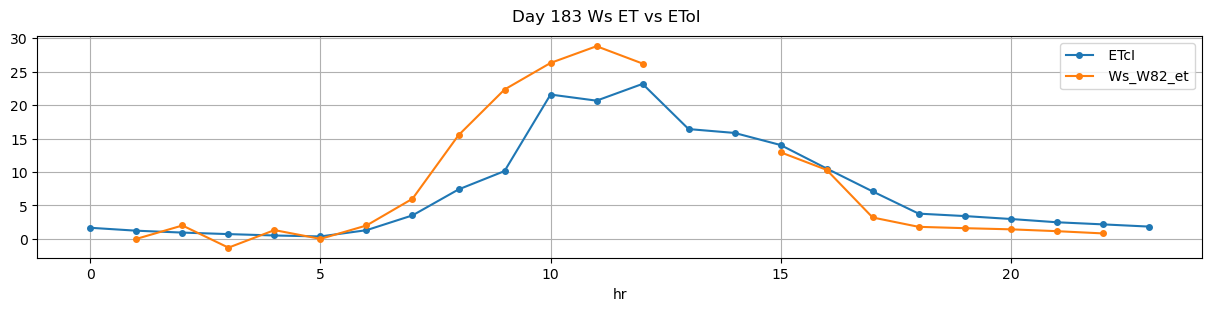
183 |
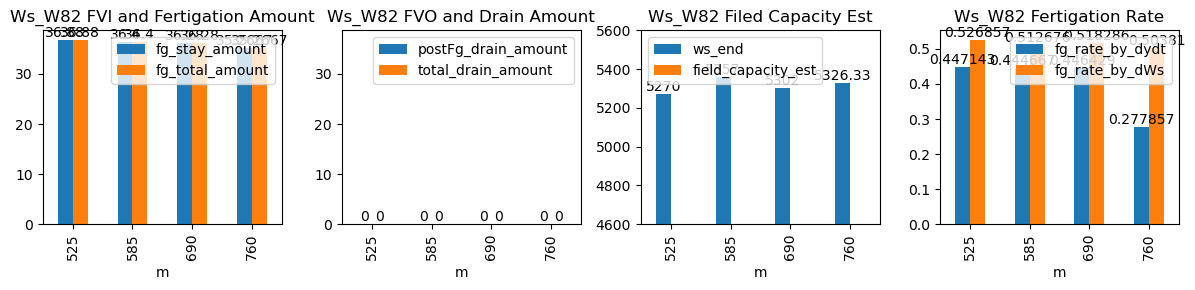
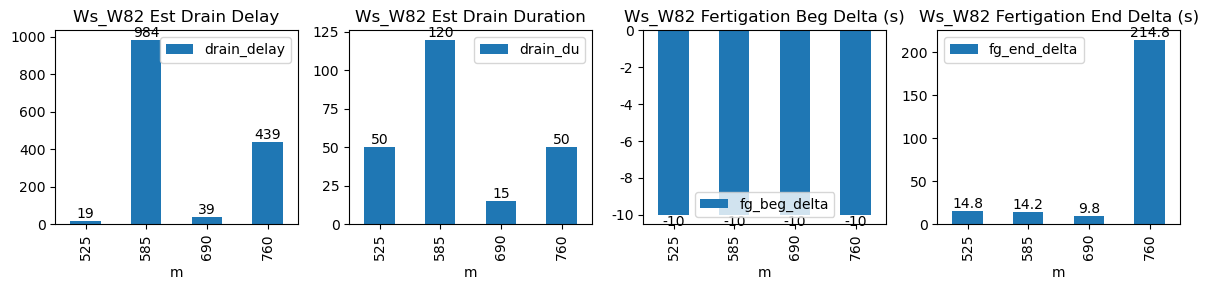
525 |
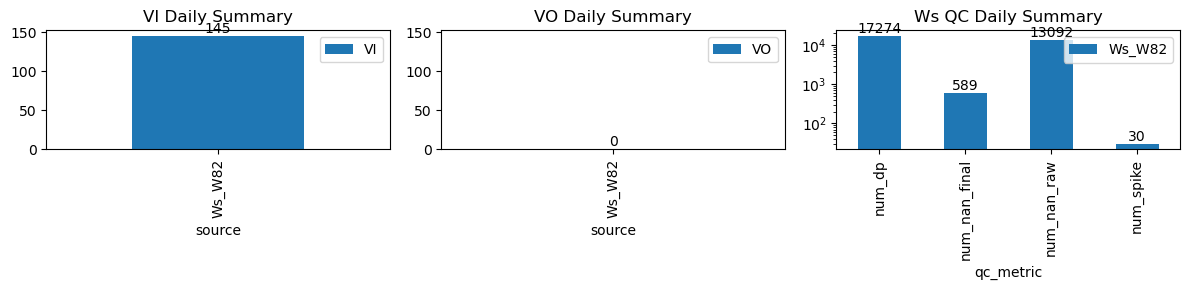
Ws_W82 |
0.903165 |
30 |
525.0 |
524.833333 |
526.17 |
526.416667 |
5085.6 |
5270.000000 |
70 |
-0.104297 |
-0.125103 |
-0.137963 |
0.447143 |
0.526857 |
36.880000 |
True |
-10.0 |
14.8 |
36.880000 |
0.0 |
0 |
0.0 |
50 |
19 |
-0.098699 |
NaN |
| 2026-04-07 09:45:00+08:00 |
183 |
585 |
Ws_W82 |
0.903165 |
30 |
585.0 |
584.833333 |
586.18 |
586.416667 |
5175.0 |
5357.000000 |
71 |
-0.162008 |
-0.190226 |
-0.147531 |
0.444667 |
0.512676 |
36.400000 |
True |
-10.0 |
14.2 |
36.400000 |
0.0 |
0 |
0.0 |
120 |
984 |
-0.070598 |
NaN |
| 2026-04-07 11:30:00+08:00 |
183 |
690 |
Ws_W82 |
0.903165 |
30 |
690.0 |
689.833333 |
691.17 |
691.333333 |
5120.6 |
5302.000000 |
70 |
-0.204085 |
-0.193416 |
-0.184753 |
0.446429 |
0.518286 |
36.280000 |
True |
-10.0 |
9.8 |
36.280000 |
0.0 |
0 |
0.0 |
15 |
39 |
-0.111272 |
NaN |
| 2026-04-07 12:40:00+08:00 |
183 |
760 |
Ws_W82 |
0.903165 |
30 |
760.0 |
759.833333 |
761.17 |
764.750000 |
5150.0 |
5326.333333 |
70 |
-0.153818 |
-0.184053 |
-0.080075 |
0.277857 |
0.503810 |
35.266667 |
True |
-10.0 |
214.8 |
35.266667 |
0.0 |
0 |
0.0 |
50 |
439 |
-0.267959 |
NaN |