| 2026-04-09 08:13:12+08:00 |
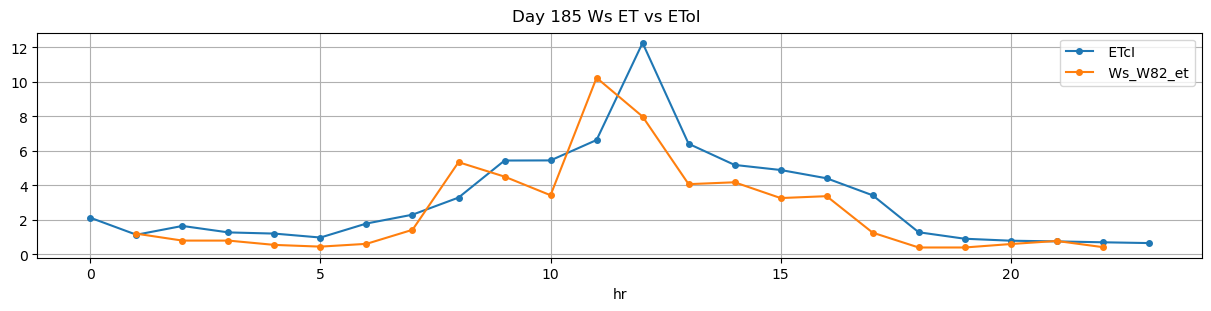
185 |
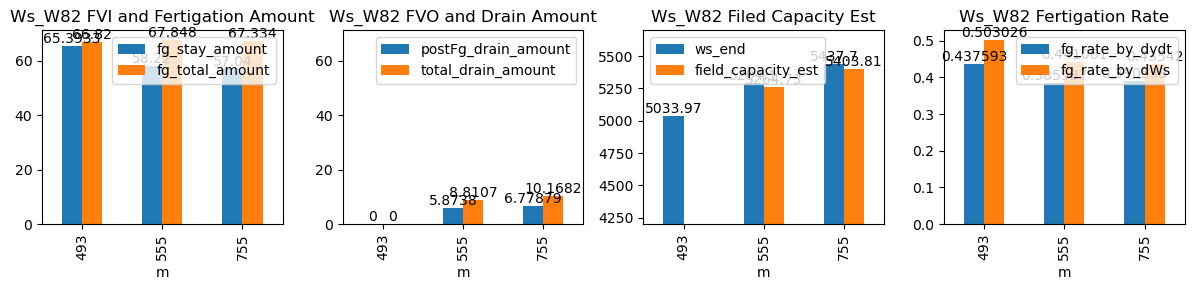
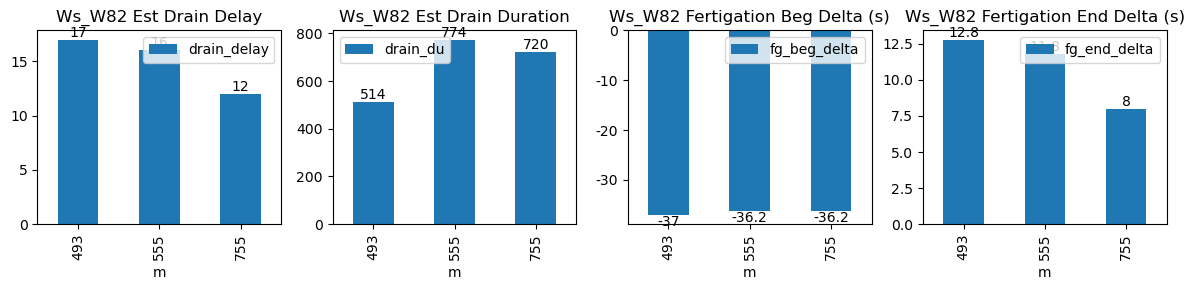
493 |
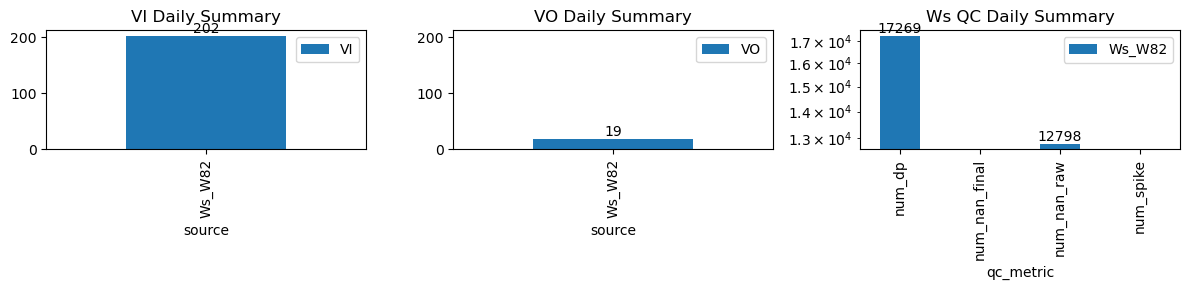
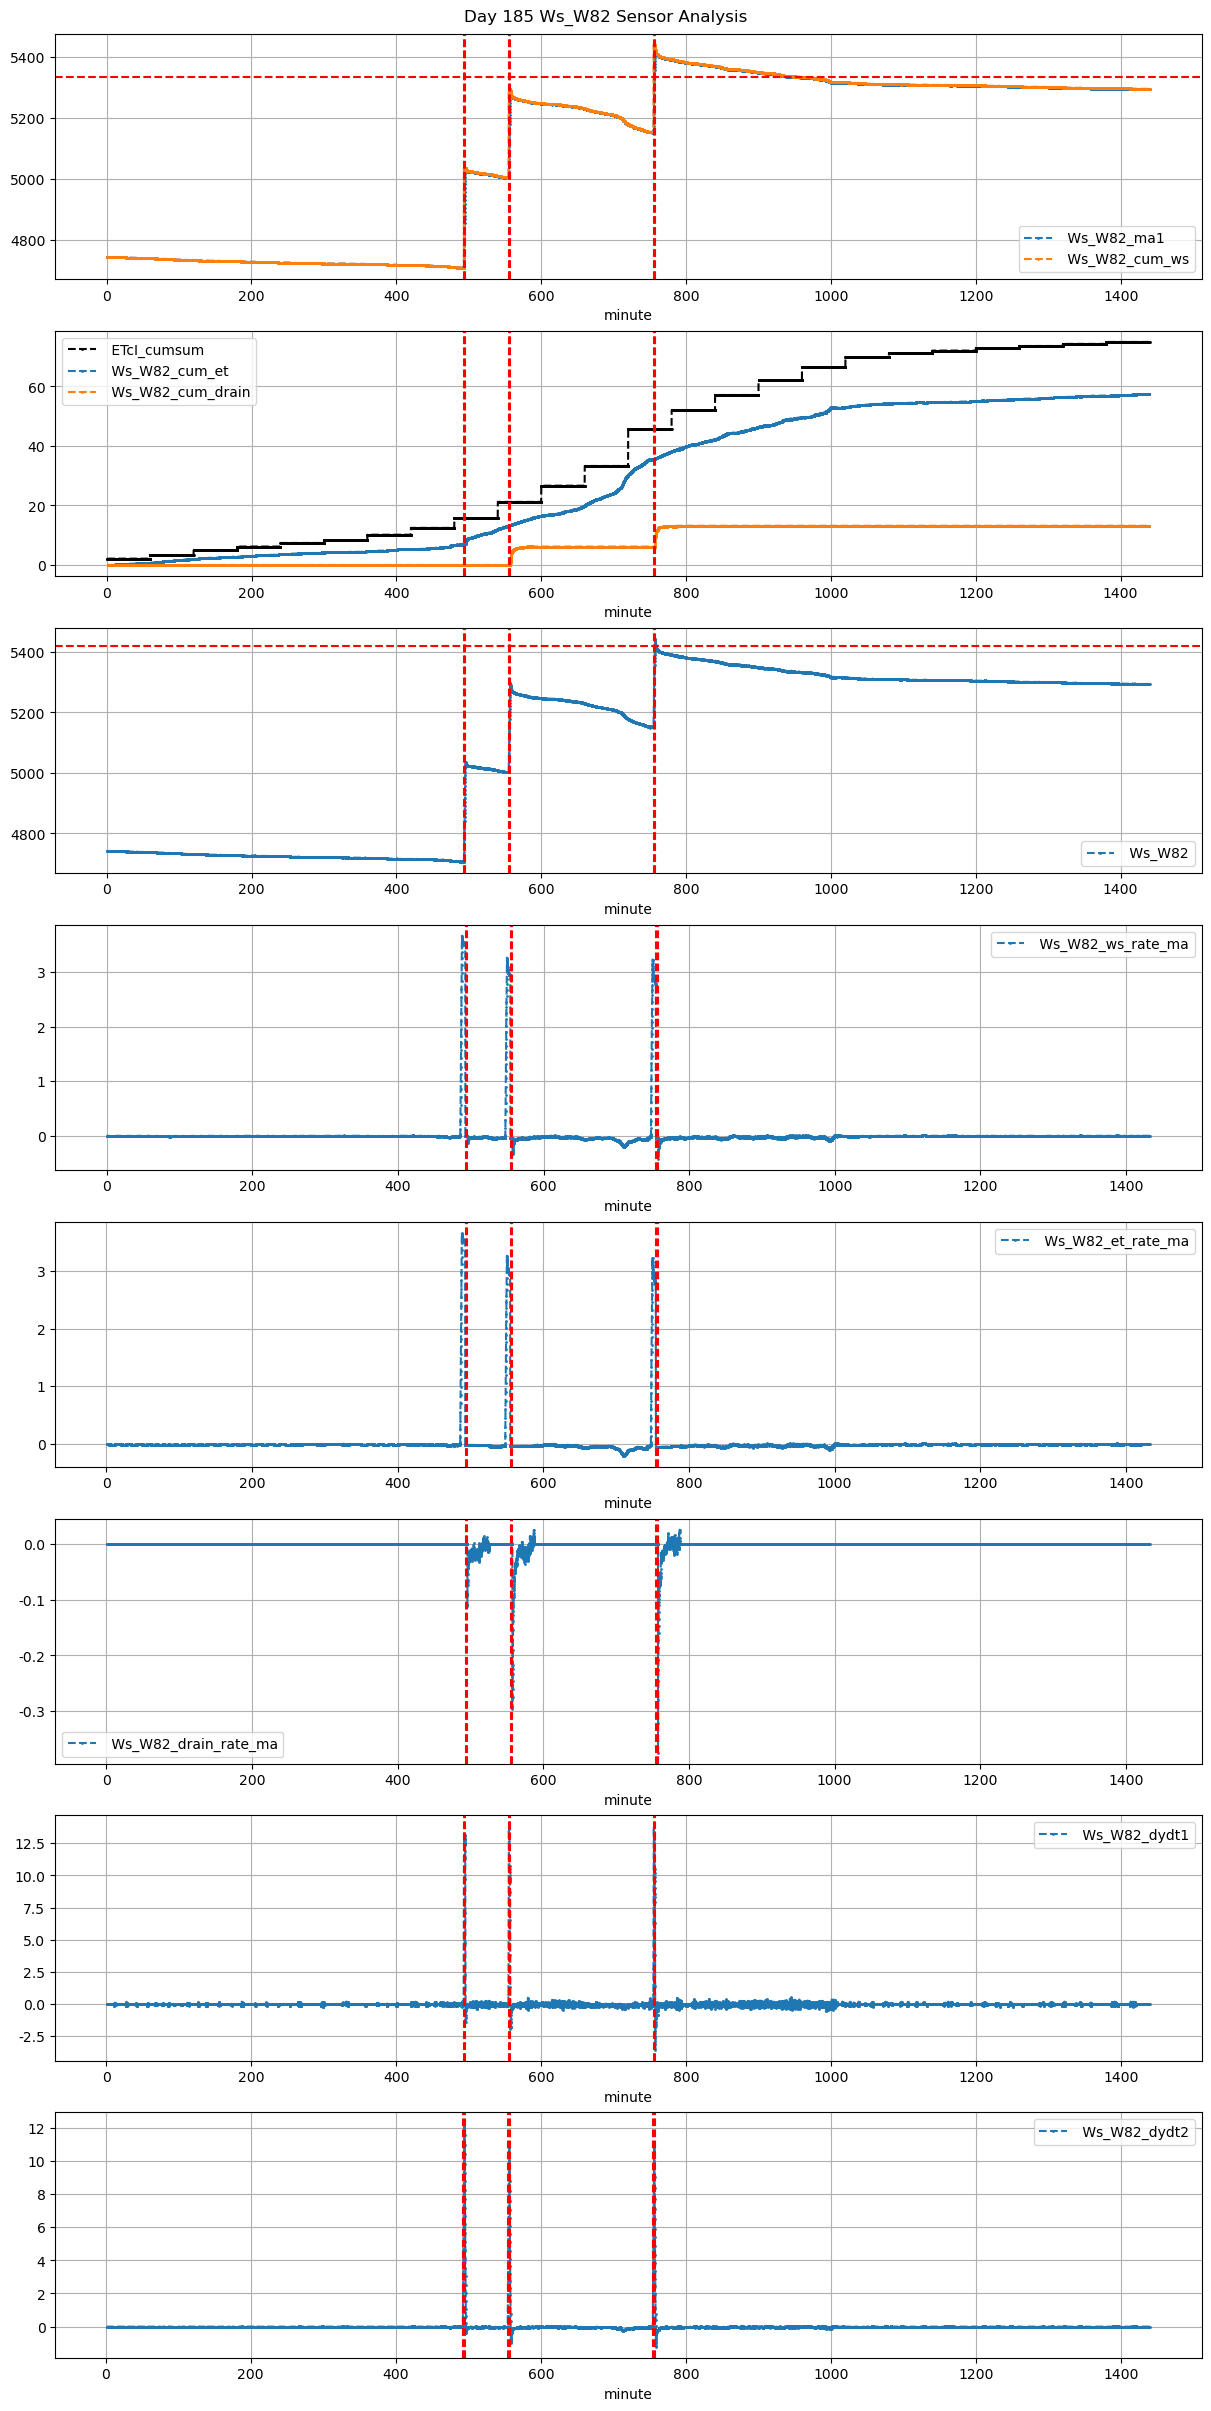
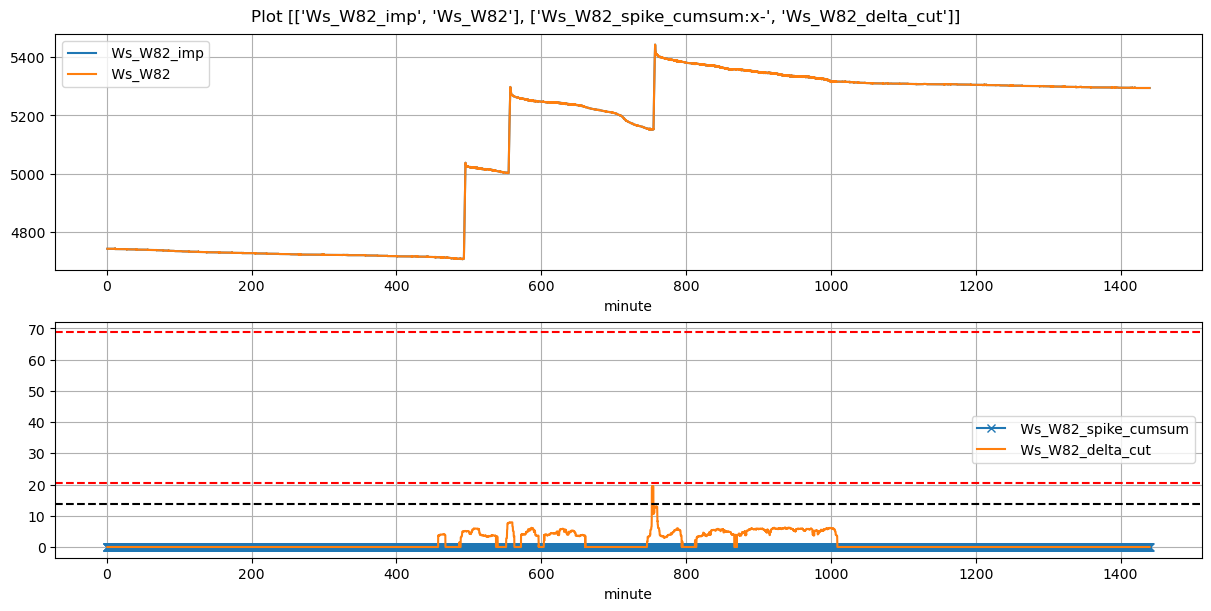
Ws_W82 |
0.267382 |
30 |
493.20 |
492.583333 |
495.37 |
495.583333 |
4707.0 |
5033.966667 |
130 |
-0.013080 |
-0.039650 |
-0.019969 |
0.437593 |
0.503026 |
65.393333 |
True |
-37.0 |
12.8 |
66.820 |
0.000000 |
0.000000 |
0.000000 |
514 |
17 |
-0.033437 |
NaN |
| 2026-04-09 09:15:01+08:00 |
185 |
555 |
Ws_W82 |
0.267382 |
30 |
555.02 |
554.416667 |
557.22 |
557.416667 |
5003.0 |
5294.100000 |
132 |
-0.034924 |
-0.104455 |
-0.028313 |
0.385587 |
0.441061 |
58.220000 |
True |
-36.2 |
11.8 |
67.848 |
2.936899 |
5.873799 |
8.810698 |
774 |
16 |
-0.098618 |
5264.731007 |
| 2026-04-09 12:35:01+08:00 |
185 |
755 |
Ws_W82 |
0.267382 |
30 |
755.02 |
754.416667 |
757.20 |
757.333333 |
5152.5 |
5437.700000 |
131 |
-0.047133 |
-0.116671 |
-0.038827 |
0.390533 |
0.435420 |
57.040000 |
True |
-36.2 |
8.0 |
67.334 |
3.389394 |
6.778788 |
10.168181 |
720 |
12 |
-0.111289 |
5403.806062 |