VI and VO Daily Summary
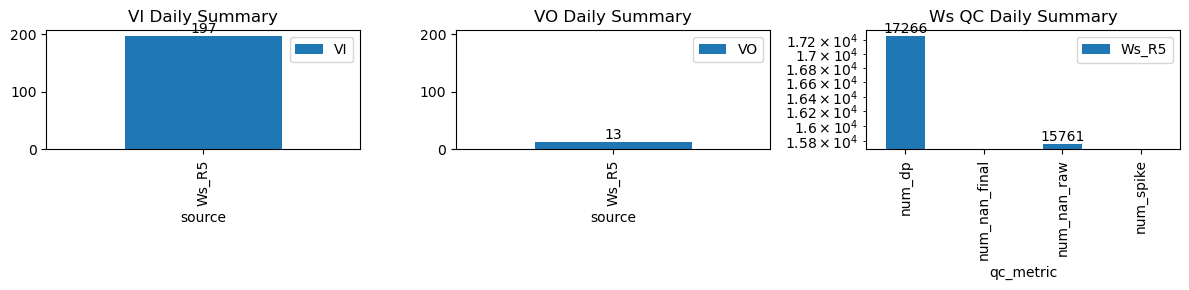
| ws_name | num_dp | num_nan_raw | num_nan_final | num_spike | cum_step_adj |
|---|---|---|---|---|---|
| Ws_R5 | 17,266 | 15,761 | 0 | 0 | 0.00 |
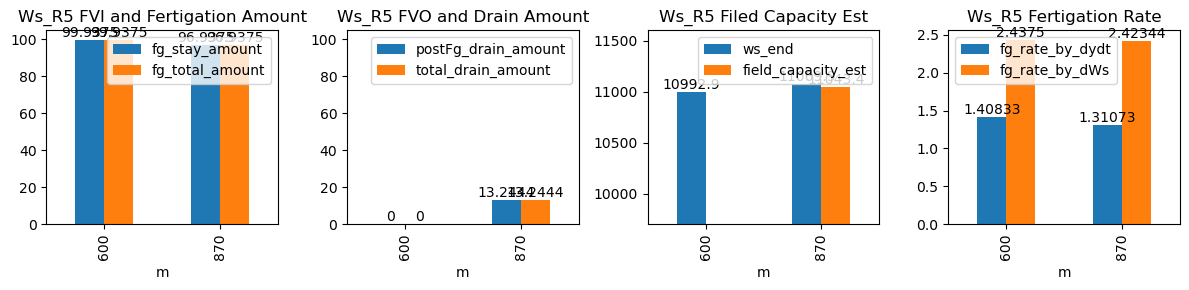
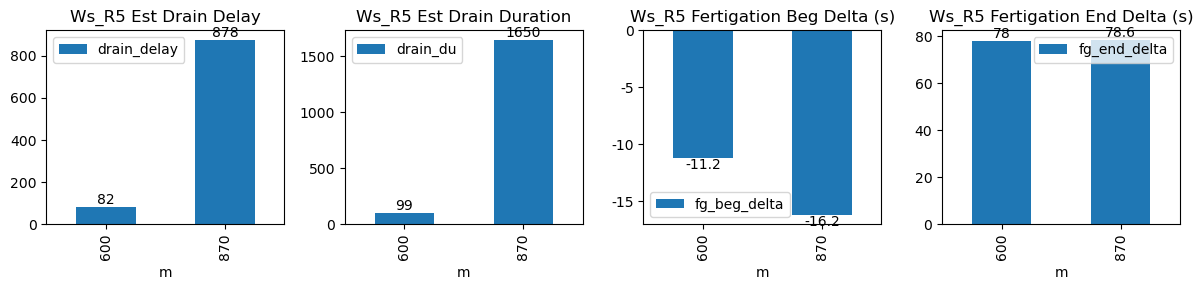
| ds | d | m | ws_name | prominence_cut | max_drain_du | fg_beg | fg_beg_est | fg_end | fg_end_est | ws_beg | ws_end | duc | pre_fg_et | post_fg_ws | post_drn_et | fg_rate_by_dydt | fg_rate_by_dWs | fg_stay_amount | enough_data | fg_beg_delta | fg_end_delta | fg_total_amount | fg_drain_amount | postFg_drain_amount | total_drain_amount | drain_du | drain_delay | drain_rate | field_capacity_est |
|---|---|---|---|---|---|---|---|---|---|---|---|---|---|---|---|---|---|---|---|---|---|---|---|---|---|---|---|---|---|
| 2026-04-08 10:00:01+08:00 | 168 | 600 | Ws_R5 | 0.308327 | 50 | 600.02 | 599.833333 | 600.70 | 602.0 | 10793.0 | 10992.875 | 41 | -0.034956 | -0.042546 | -0.051358 | 1.408333 | 2.437500 | 99.9375 | True | -11.2 | 78.0 | 99.9375 | 0.0 | 0.000000 | 0.000000 | 99 | 82 | -0.027021 | NaN |
| 2026-04-08 14:30:01+08:00 | 168 | 870 | Ws_R5 | 0.308327 | 50 | 870.02 | 869.750000 | 870.69 | 872.0 | 10876.0 | 11069.875 | 40 | -0.007980 | -0.039882 | -0.056440 | 1.310733 | 2.423437 | 96.9375 | True | -16.2 | 78.6 | 96.9375 | 0.0 | 13.244427 | 13.244427 | 1650 | 878 | -0.160798 | 11043.386147 |