VI and VO Daily Summary
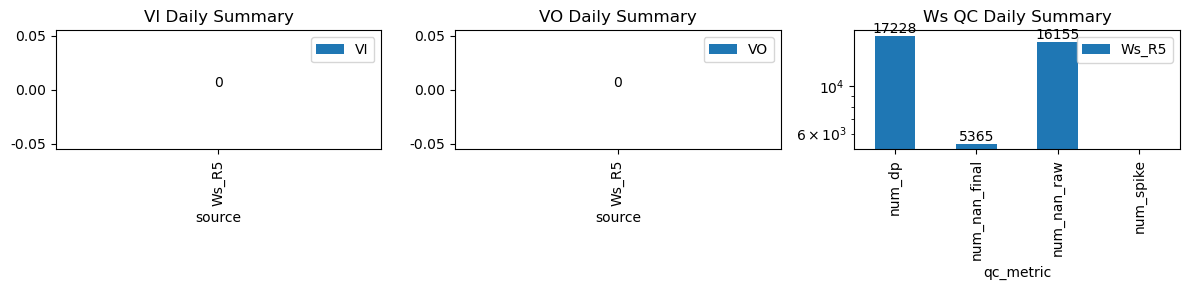
| ws_name | num_dp | num_nan_raw | num_nan_final | num_spike | cum_step_adj |
|---|---|---|---|---|---|
| Ws_R5 | 17,228 | 16,155 | 5,365 | 0 | 0.00 |
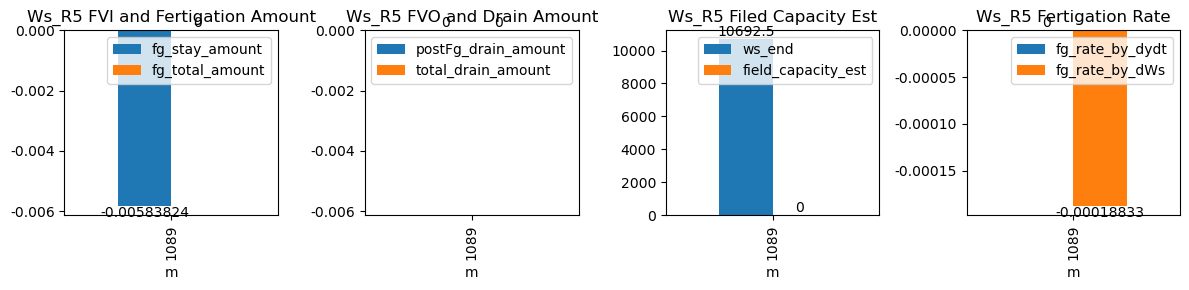
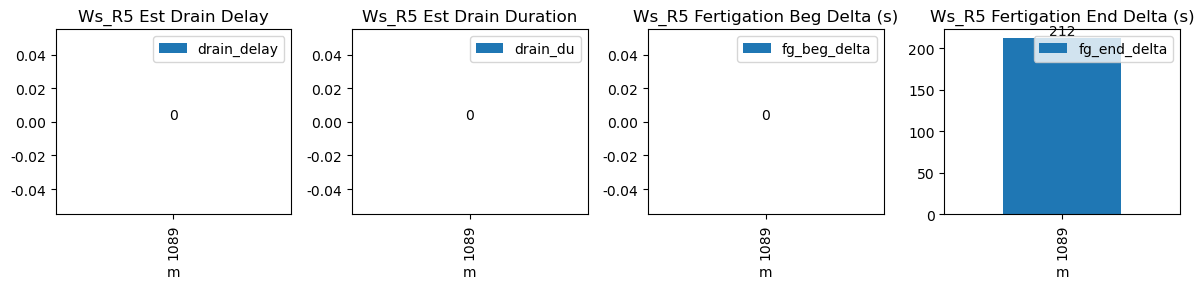
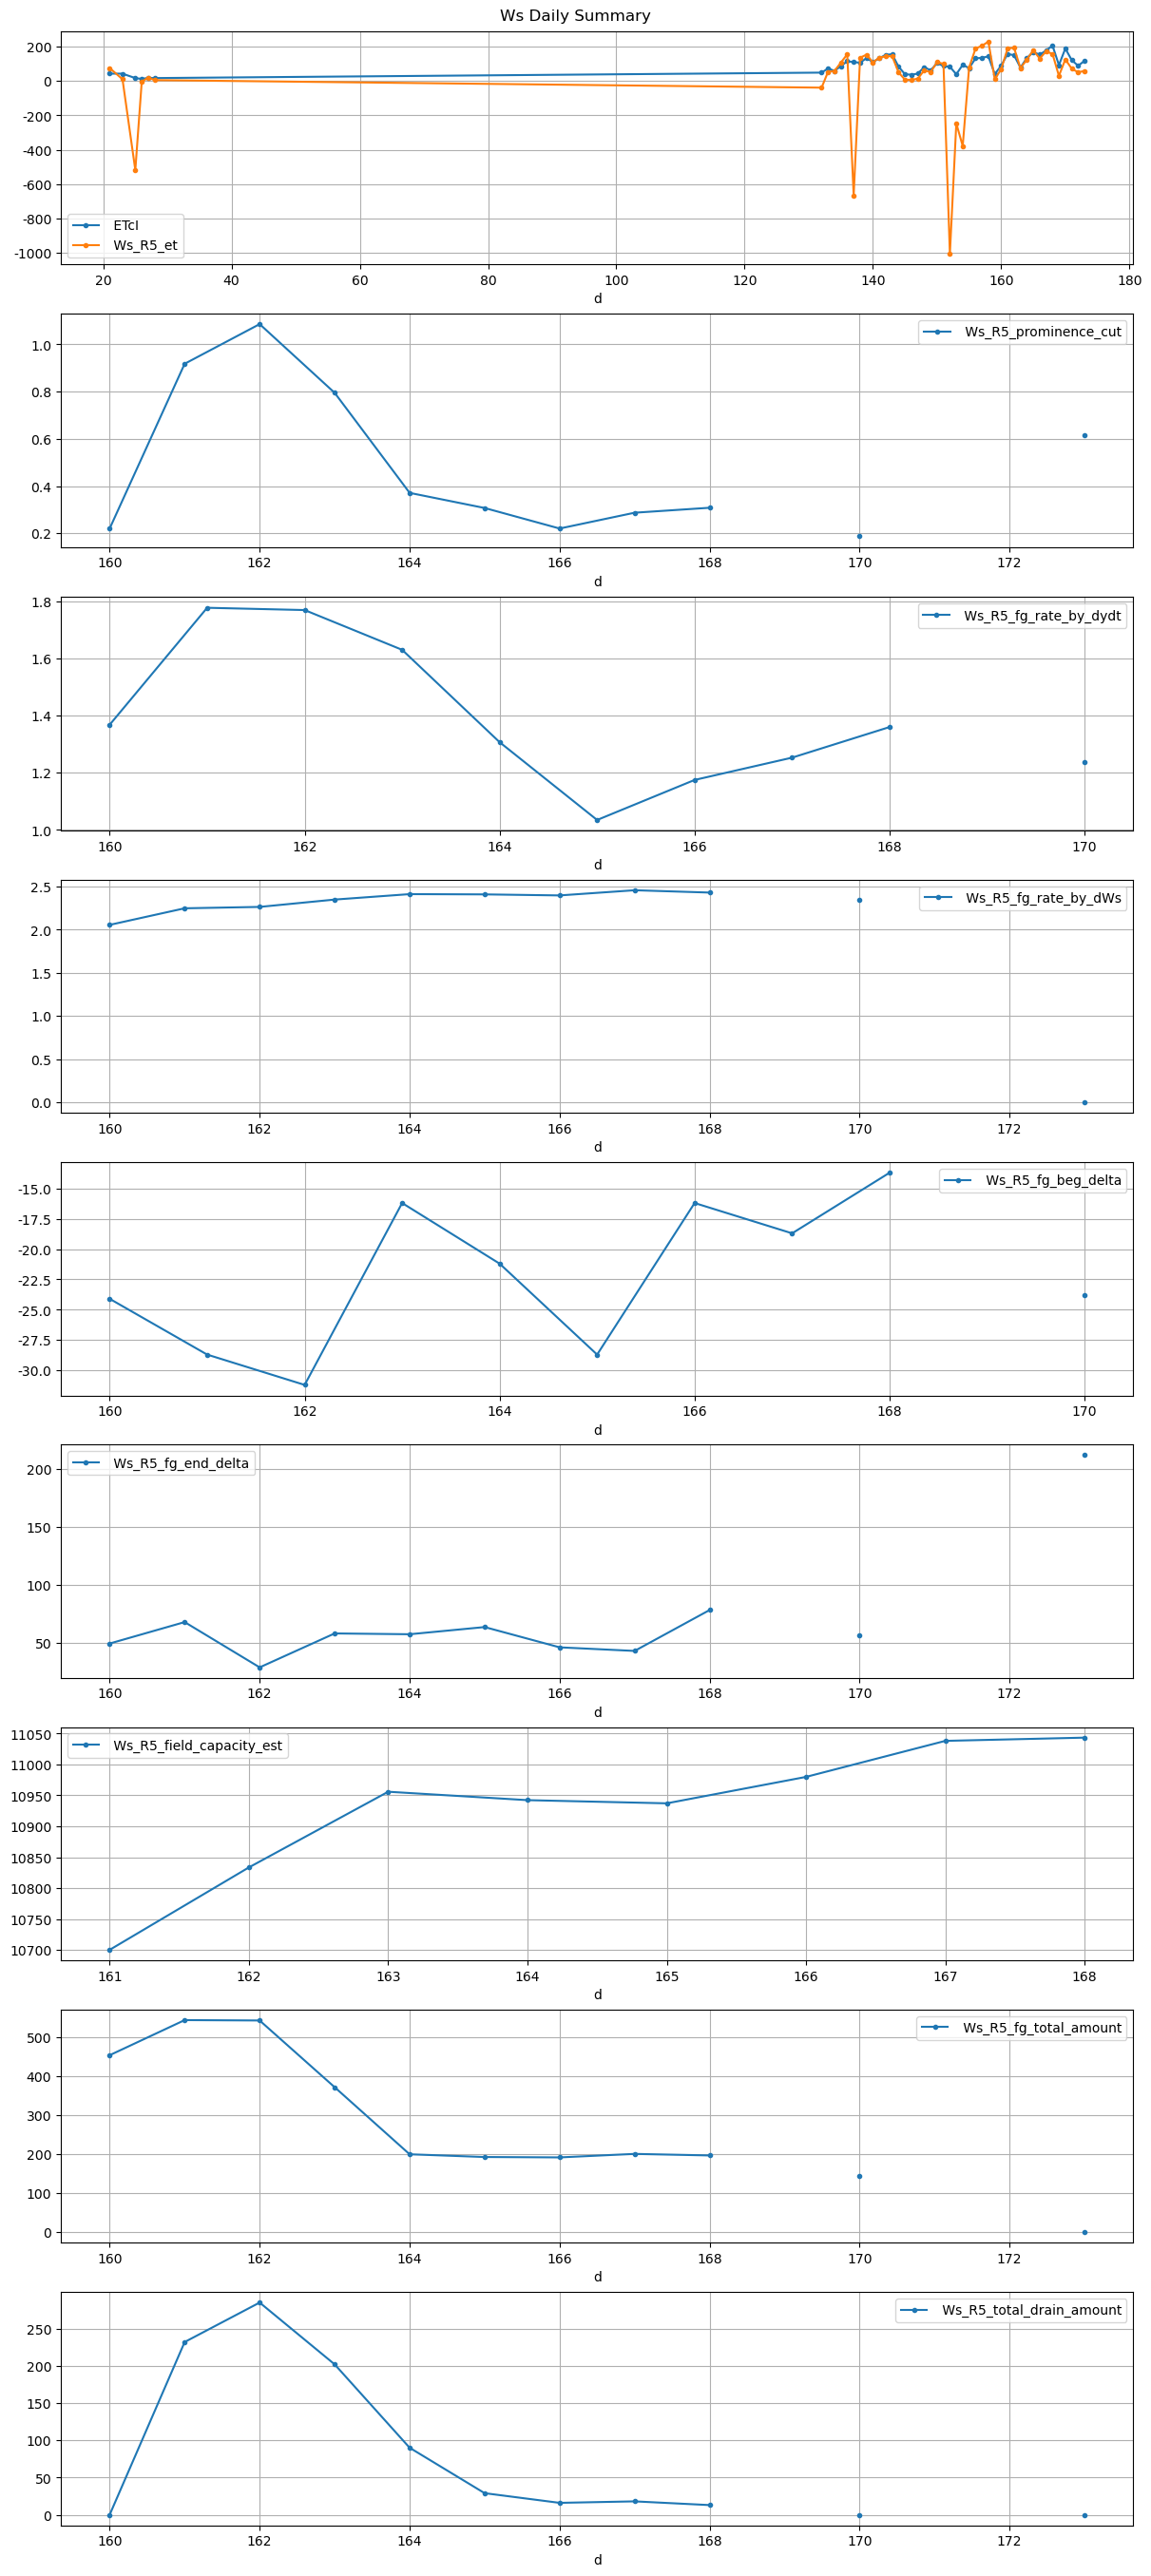
| ds | d | m | ws_name | prominence_cut | max_drain_du | fg_beg | fg_beg_est | fg_end | fg_end_est | ws_beg | ws_end | duc | pre_fg_et | post_fg_ws | post_drn_et | fg_rate_by_dydt | fg_rate_by_dWs | fg_stay_amount | enough_data | fg_beg_delta | fg_end_delta | fg_total_amount | fg_drain_amount | postFg_drain_amount | total_drain_amount | drain_du | drain_delay | drain_rate | field_capacity_est |
|---|---|---|---|---|---|---|---|---|---|---|---|---|---|---|---|---|---|---|---|---|---|---|---|---|---|---|---|---|---|
| 2026-04-13 18:09:02+08:00 | 173 | 1089 | Ws_R5 | 0.616933 | 50 | 1089.03 | NaN | 1089.55 | 1093.0 | NaN | 10693.0 | 31 | NaN | NaN | NaN | NaN | NaN | NaN | False | NaN | 207.0 | NaN | NaN | NaN | NaN | NaN | NaN | NaN | NaN |