| 2025-11-16 08:21:05+08:00 |
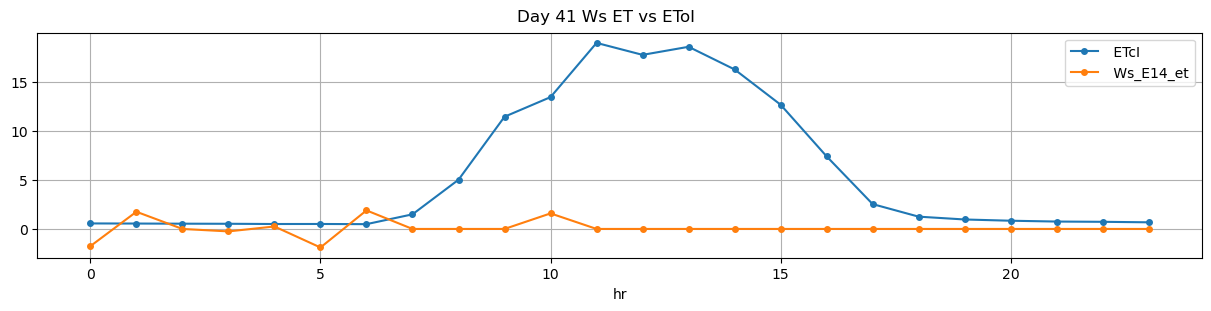
41 |
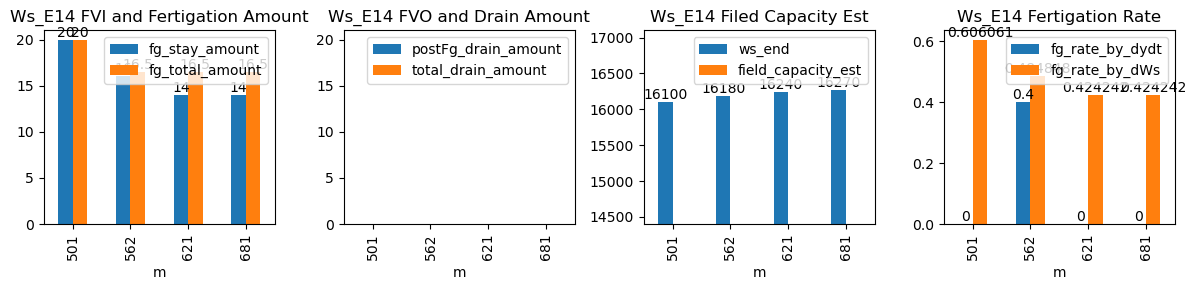
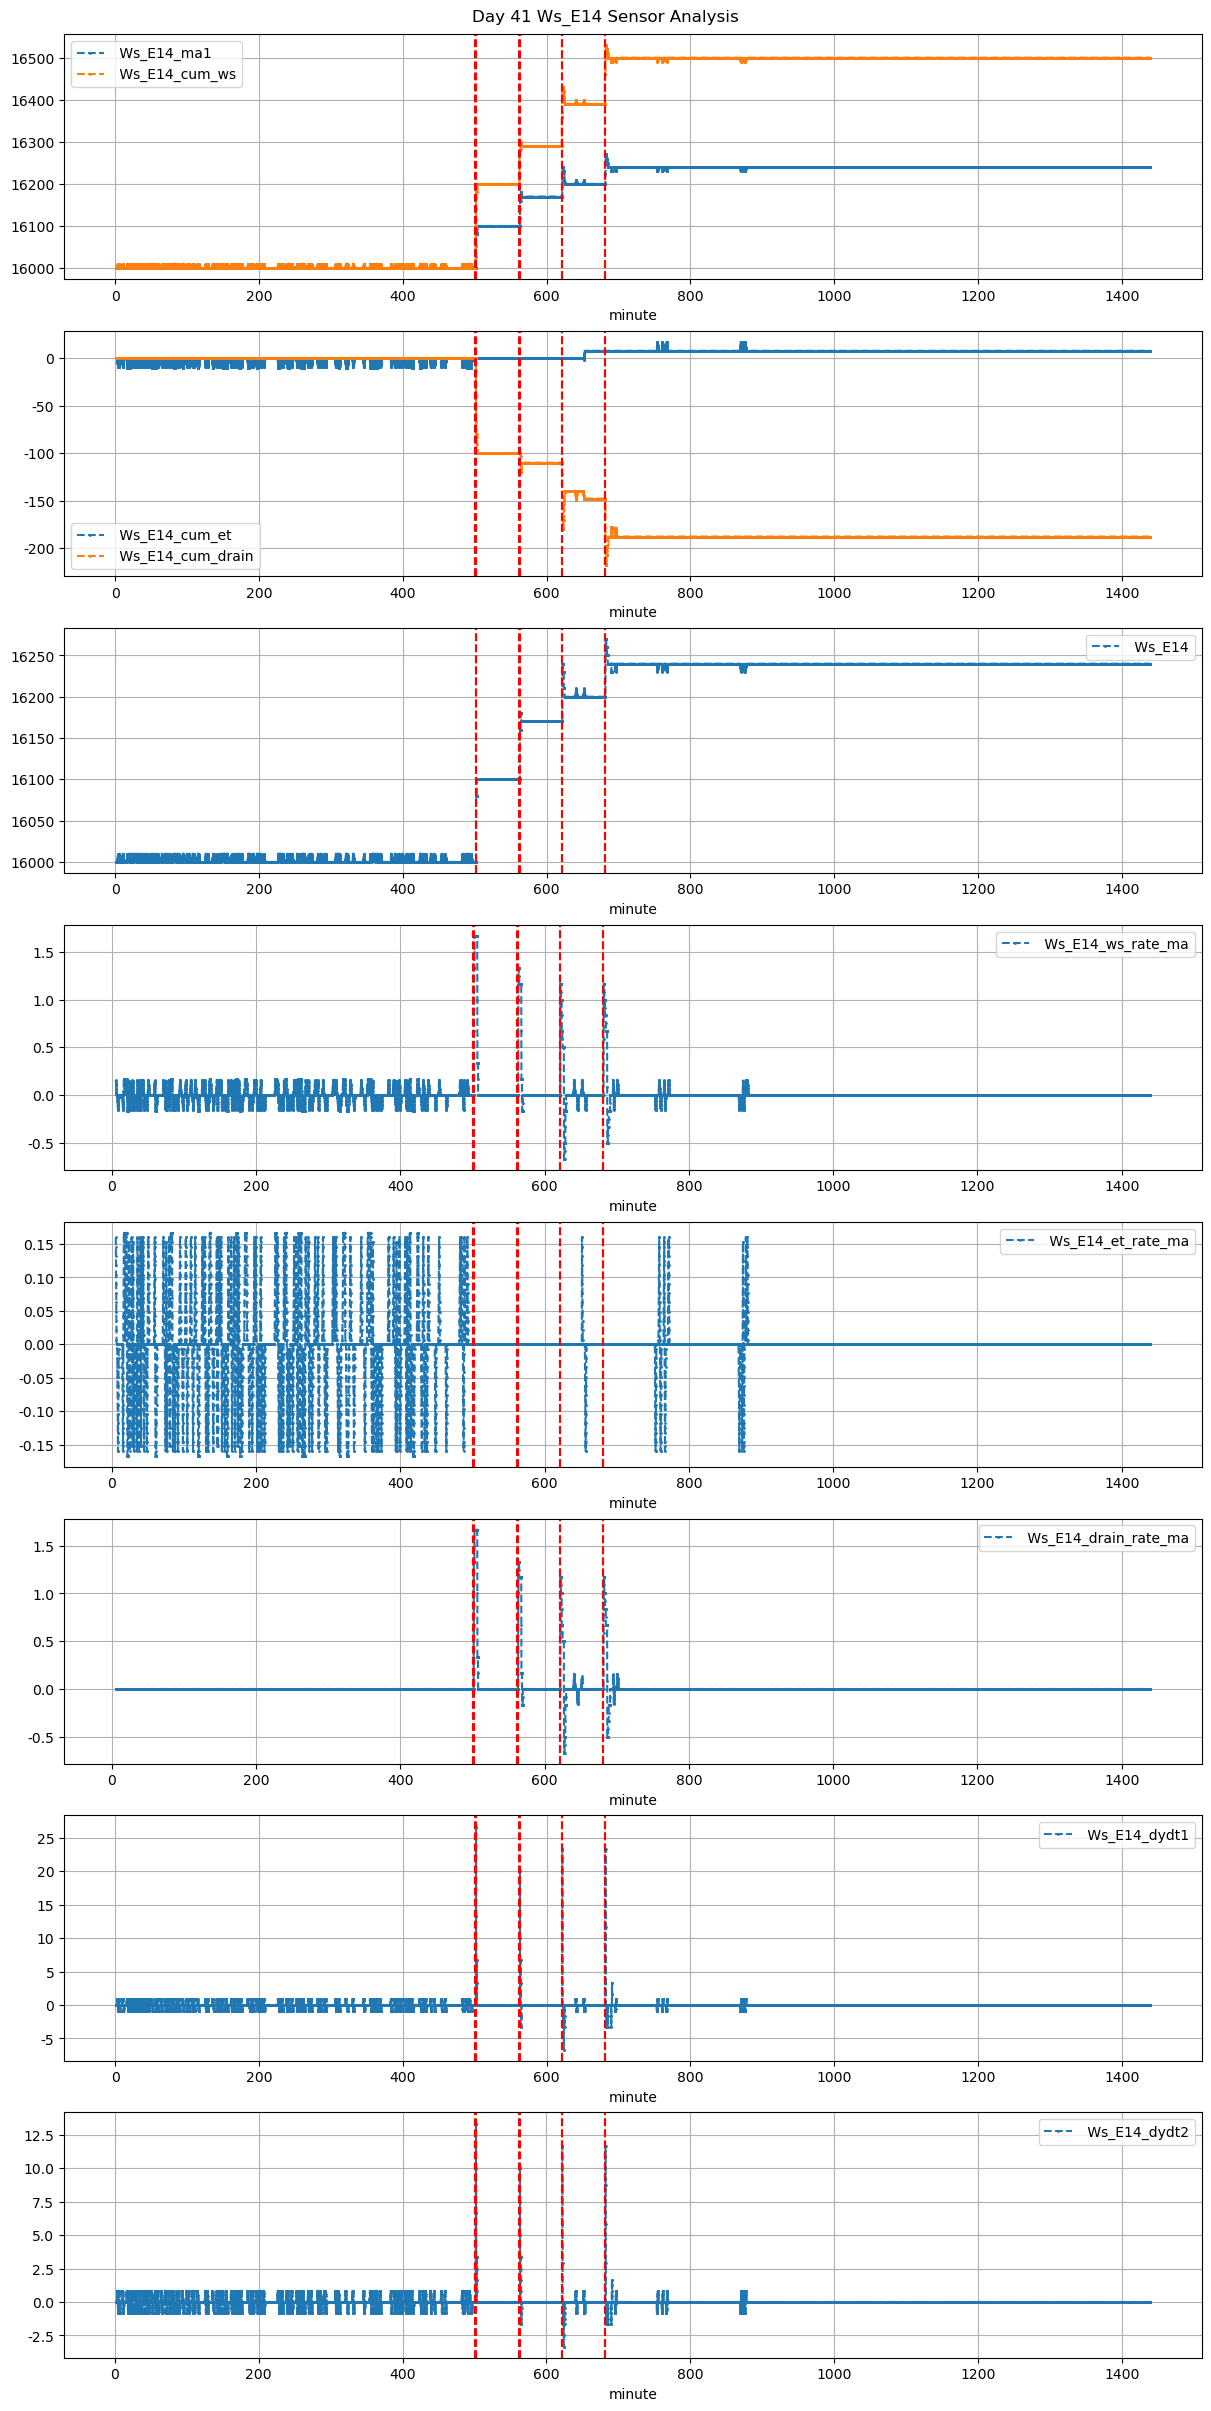
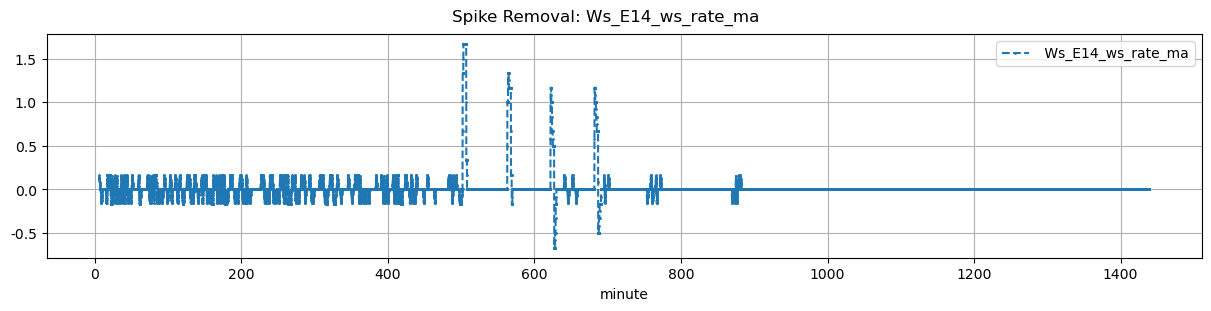
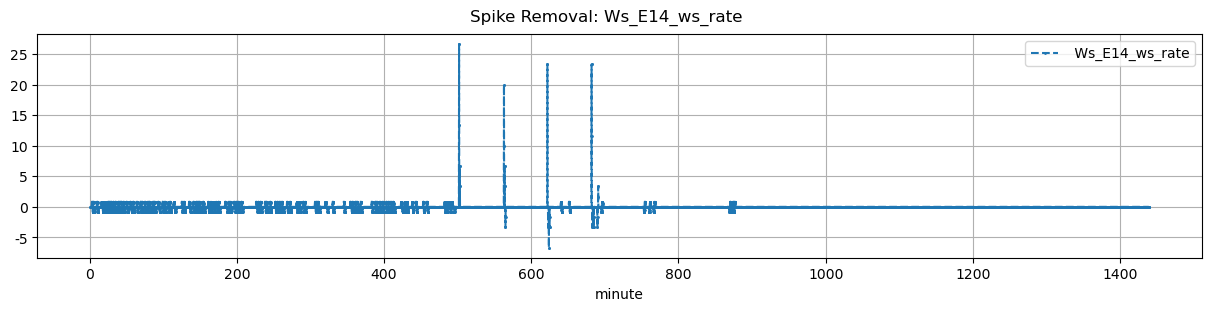
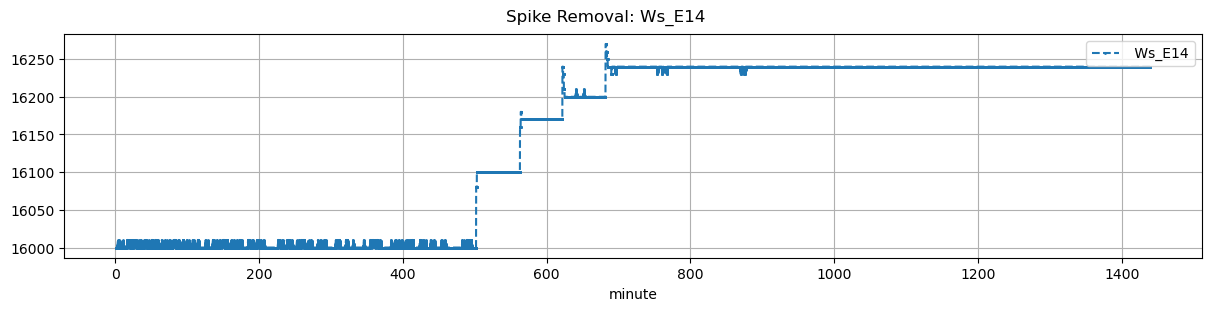
501 |
Ws_E14 |
1.075198 |
30 |
501.08 |
501.583333 |
501.63 |
501.666667 |
NaN |
NaN |
NaN |
16000.0 |
16100.0 |
33 |
-0.1 |
0.000000 |
0.0 |
NaN |
0.606061 |
20.0 |
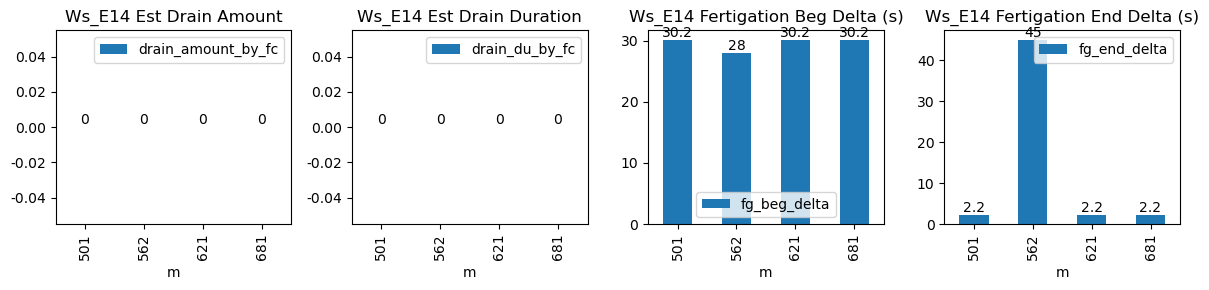
30.2 |
2.2 |
20.0 |
0.0 |
-20.000000 |
NaN |
-20.000000 |
| 2025-11-16 09:22:12+08:00 |
41 |
562 |
Ws_E14 |
1.075198 |
30 |
562.20 |
562.666667 |
562.75 |
563.500000 |
NaN |
NaN |
NaN |
16100.0 |
16180.0 |
33 |
0.0 |
-0.018056 |
0.0 |
0.4 |
0.484848 |
16.0 |
28.0 |
45.0 |
16.5 |
0.5 |
-2.000000 |
NaN |
-1.500000 |
| 2025-11-16 10:21:05+08:00 |
41 |
621 |
Ws_E14 |
1.075198 |
30 |
621.08 |
621.583333 |
621.63 |
621.666667 |
NaN |
NaN |
NaN |
16170.0 |
16240.0 |
33 |
0.0 |
-0.237500 |
0.0 |
NaN |
0.424242 |
14.0 |
30.2 |
2.2 |
16.5 |
2.5 |
-7.583333 |
NaN |
-5.083333 |
| 2025-11-16 11:21:05+08:00 |
41 |
681 |
Ws_E14 |
1.075198 |
30 |
681.08 |
681.583333 |
681.63 |
681.666667 |
NaN |
NaN |
NaN |
16200.0 |
16270.0 |
33 |
0.0 |
-0.194444 |
0.0 |
NaN |
0.424242 |
14.0 |
30.2 |
2.2 |
16.5 |
2.5 |
-8.000000 |
NaN |
-5.500000 |