| 2025-11-17 07:26:02+08:00 |
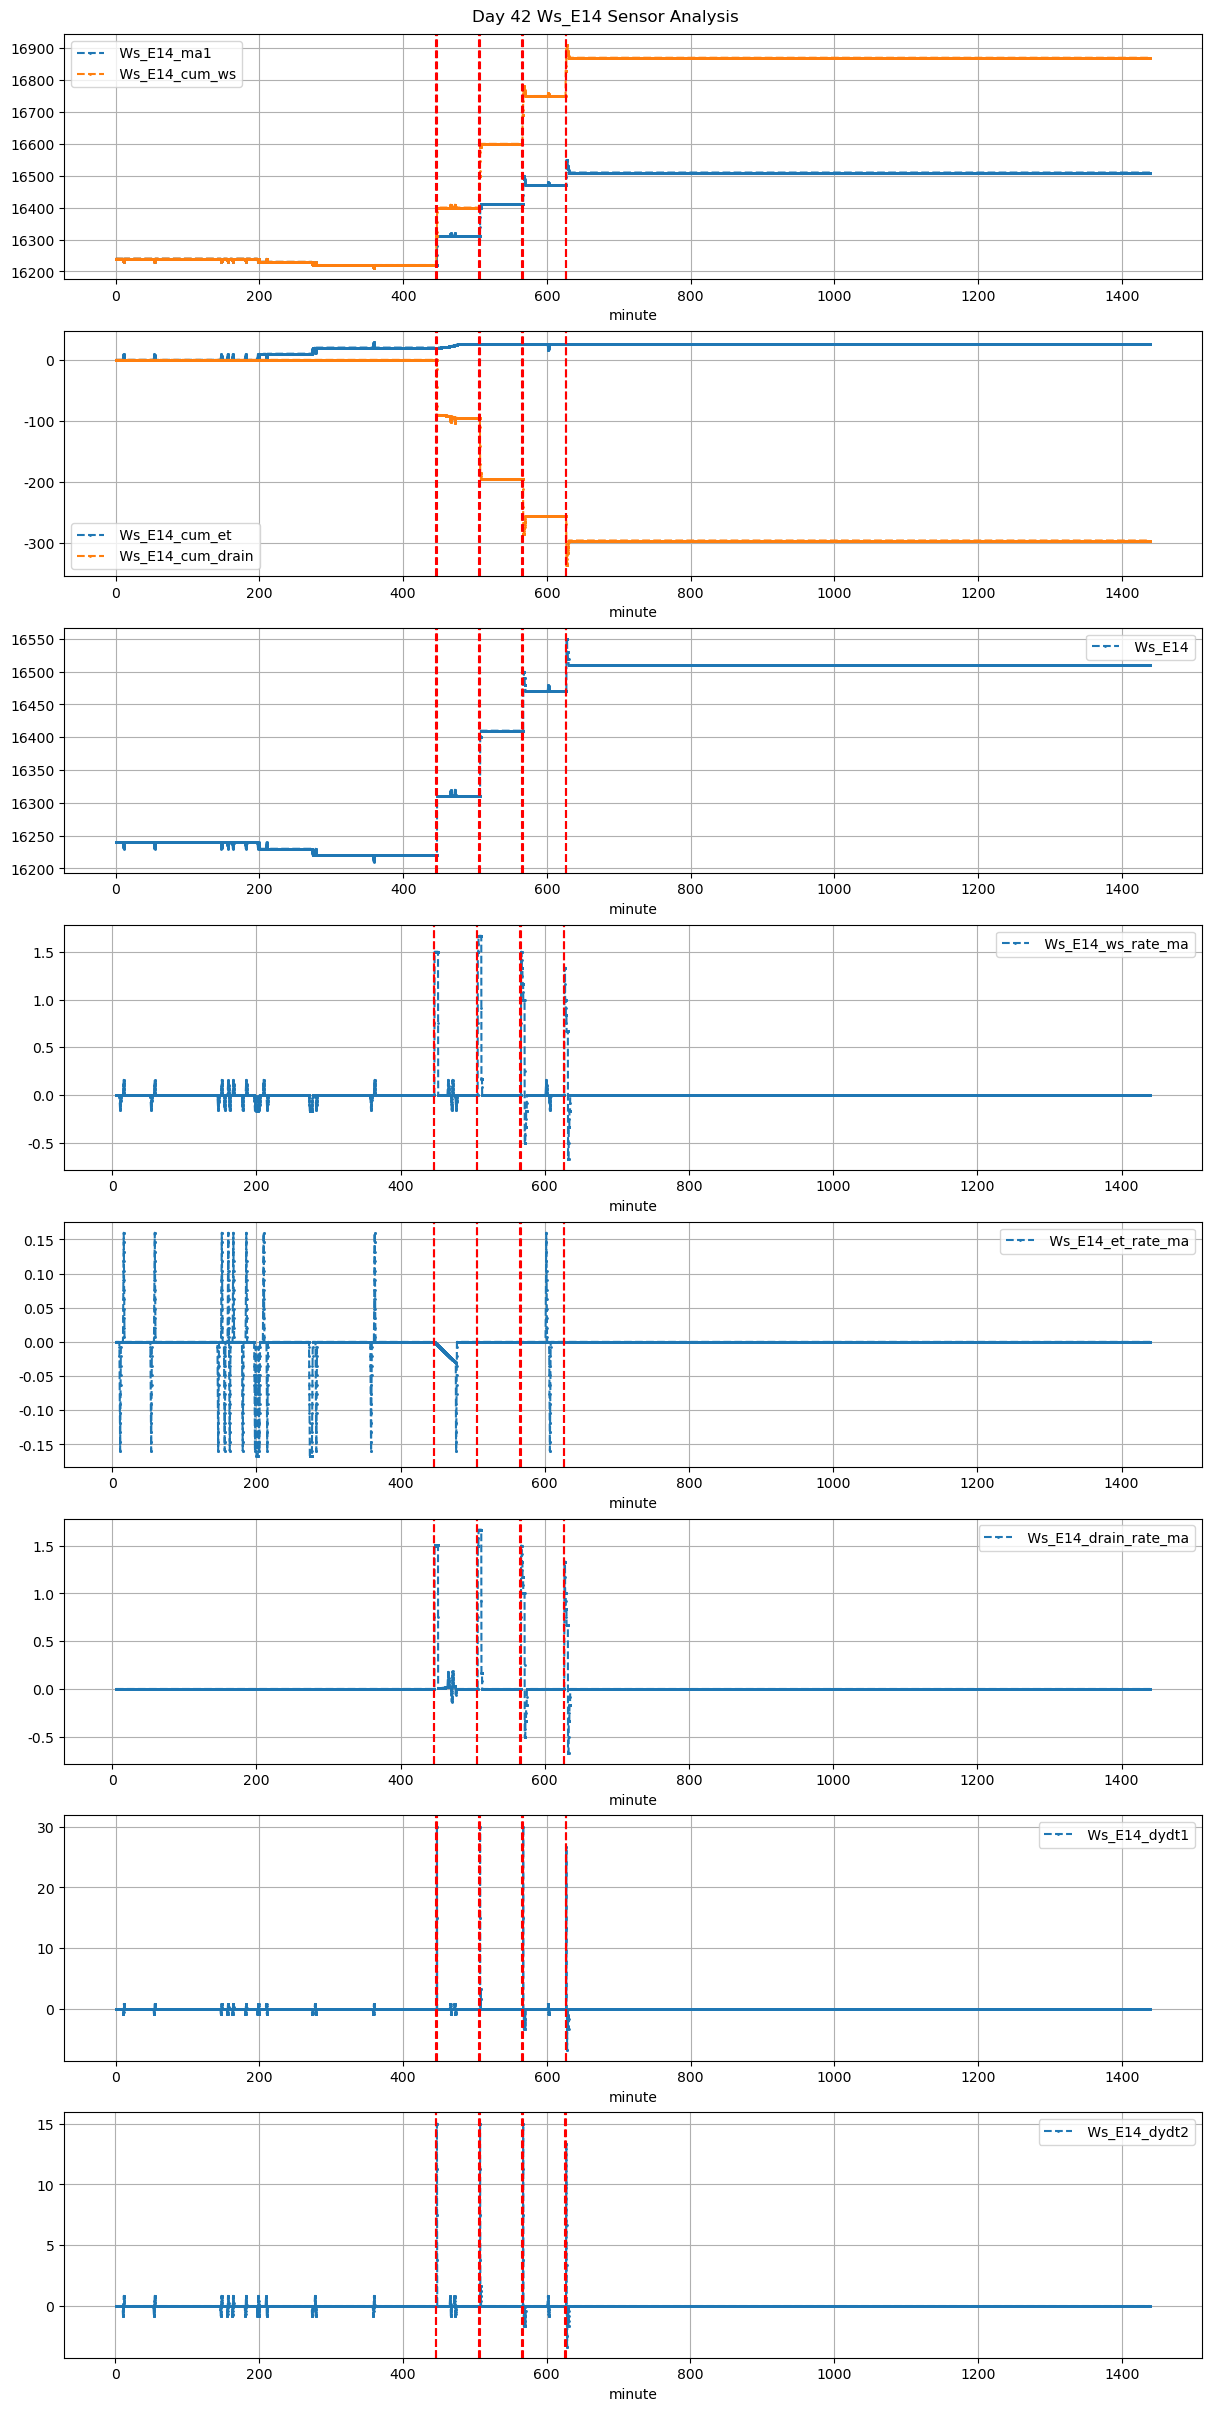
42 |
446 |
Ws_E14 |
0.581553 |
30 |
446.03 |
446.5 |
446.58 |
446.583333 |
NaN |
NaN |
NaN |
16220.0 |
16310.0 |
33 |
0.0 |
0.000000 |
-0.03044 |
NaN |
0.545455 |
18.0 |
28.2 |
0.2 |
18.0 |
0.0 |
-19.101904 |
NaN |
-19.101904 |
| 2025-11-17 08:26:02+08:00 |
42 |
506 |
Ws_E14 |
0.581553 |
30 |
506.03 |
506.5 |
506.58 |
506.583333 |
NaN |
NaN |
NaN |
16310.0 |
16410.0 |
33 |
0.0 |
0.000000 |
0.00000 |
NaN |
0.606061 |
20.0 |
28.2 |
0.2 |
20.0 |
0.0 |
-20.000000 |
NaN |
-20.000000 |
| 2025-11-17 09:26:02+08:00 |
42 |
566 |
Ws_E14 |
0.581553 |
30 |
566.03 |
566.5 |
566.58 |
566.583333 |
NaN |
NaN |
NaN |
16410.0 |
16500.0 |
33 |
0.0 |
-0.091667 |
0.00000 |
NaN |
0.545455 |
18.0 |
28.2 |
0.2 |
18.0 |
0.0 |
-12.000000 |
NaN |
-12.000000 |
| 2025-11-17 10:26:02+08:00 |
42 |
626 |
Ws_E14 |
0.581553 |
30 |
626.03 |
626.5 |
626.58 |
626.583333 |
NaN |
NaN |
NaN |
16470.0 |
16550.0 |
33 |
0.0 |
-0.150000 |
0.00000 |
NaN |
0.484848 |
16.0 |
28.2 |
0.2 |
16.5 |
0.5 |
-8.000000 |
NaN |
-7.500000 |