| 2025-11-18 08:21:05+08:00 |
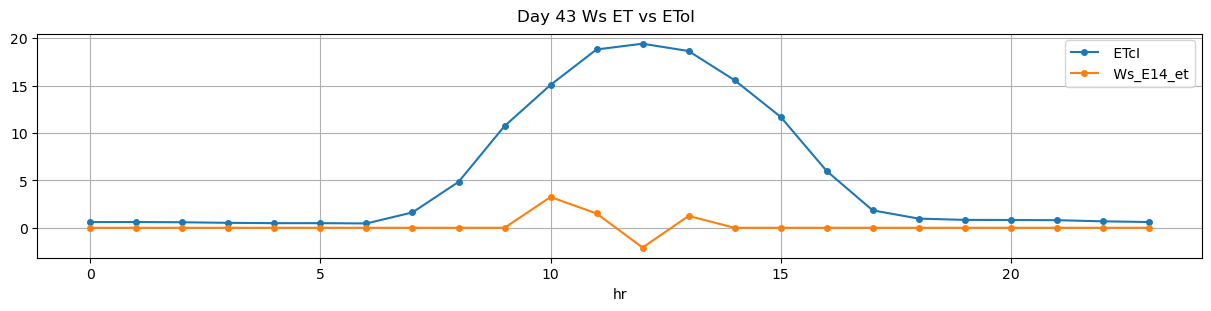
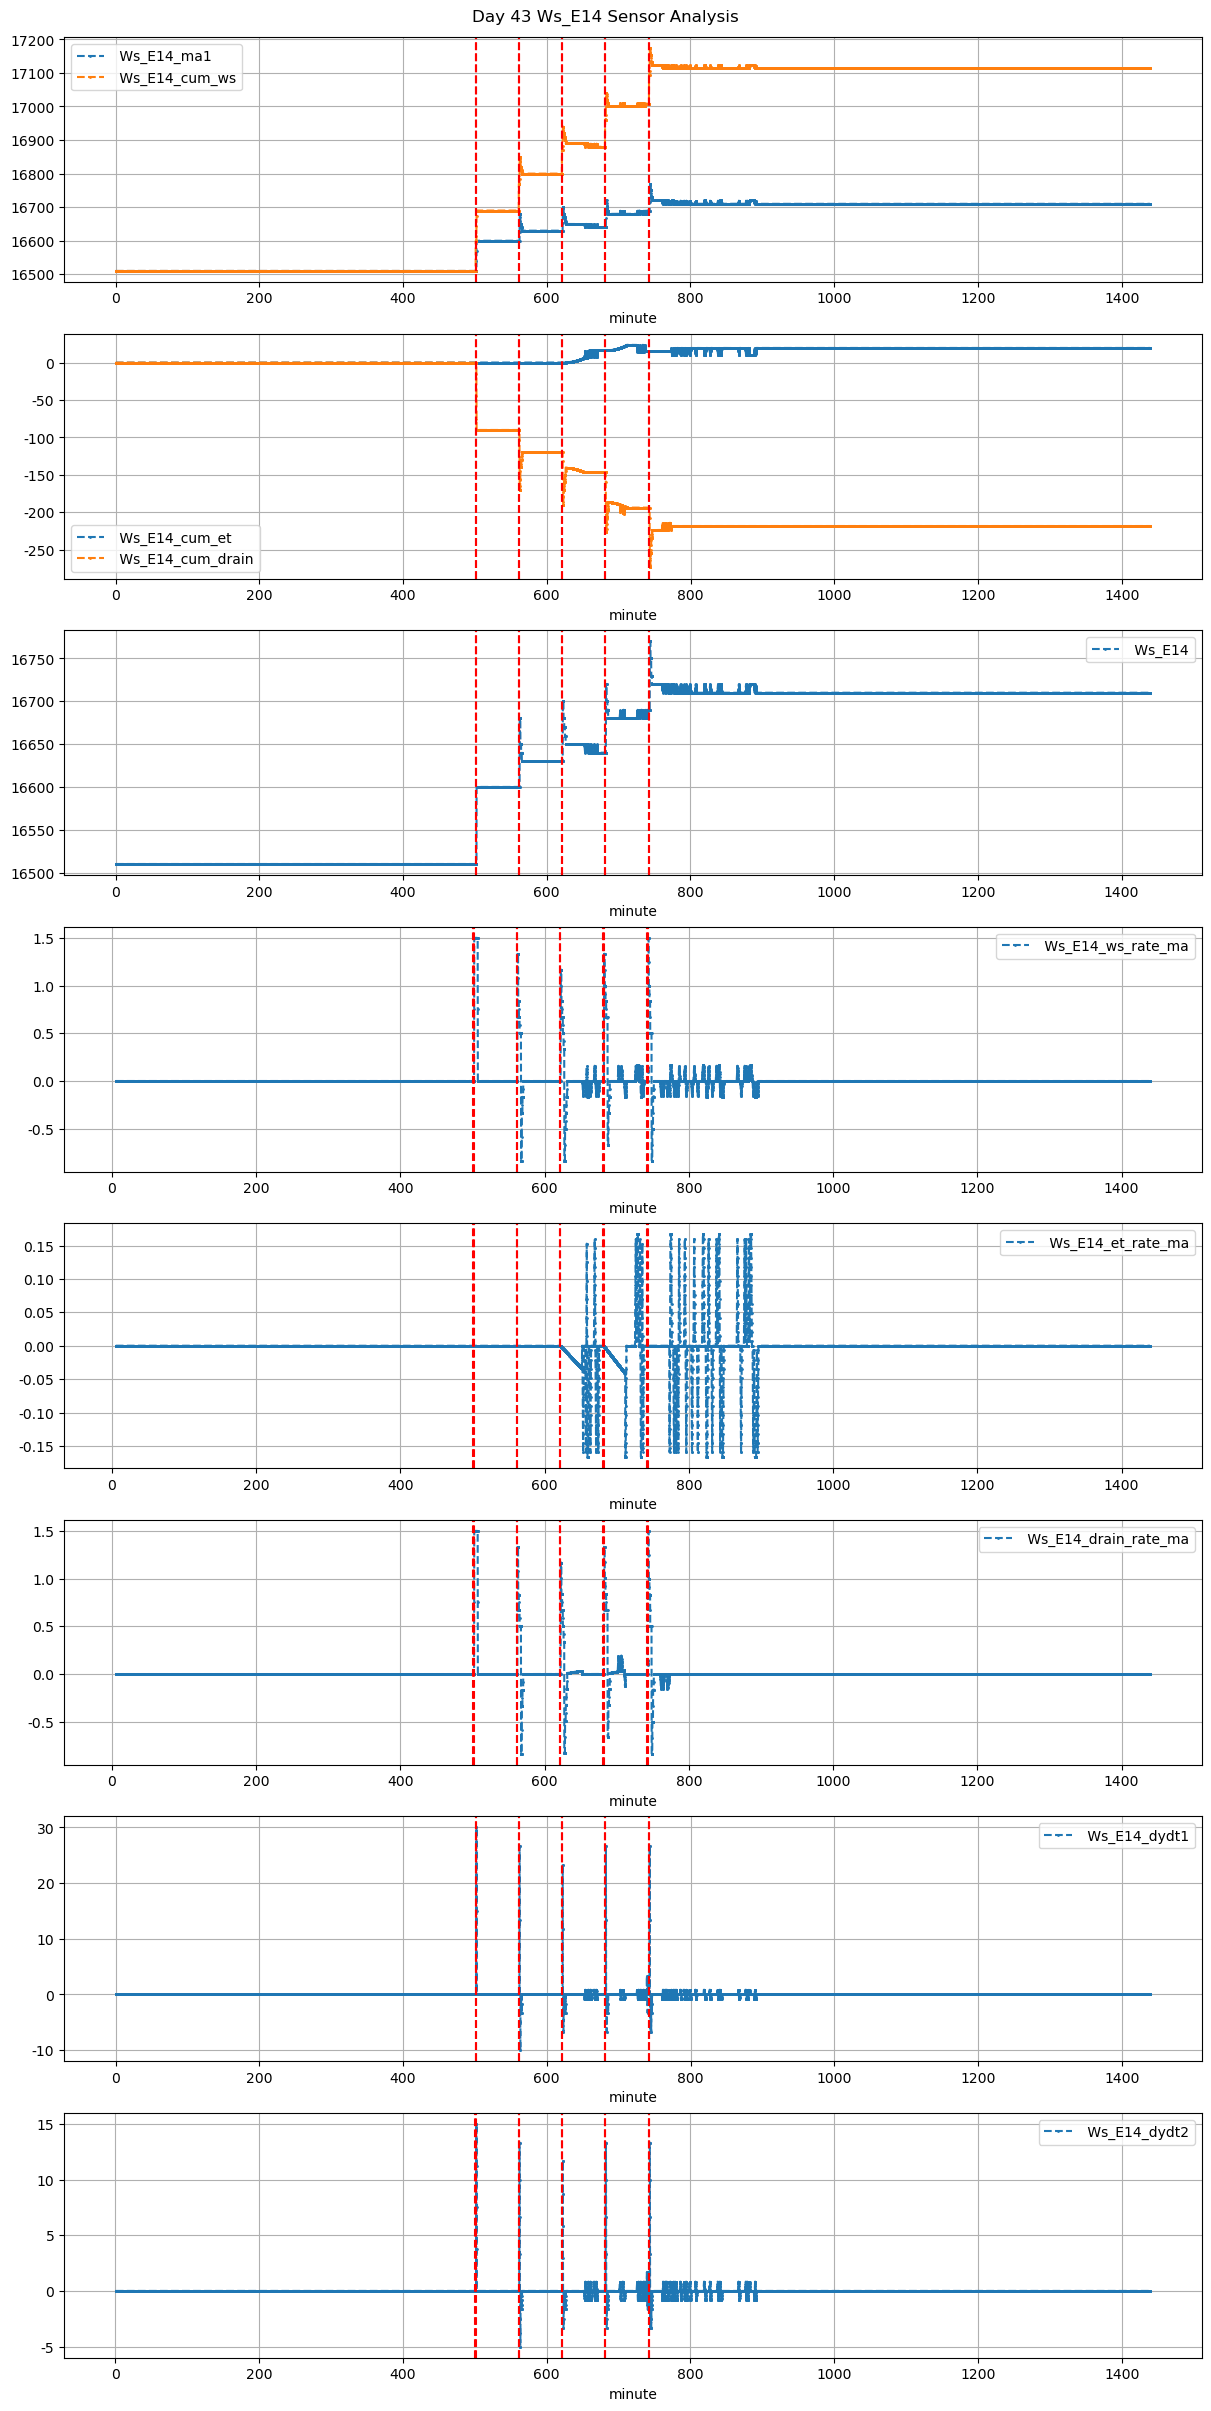
43 |
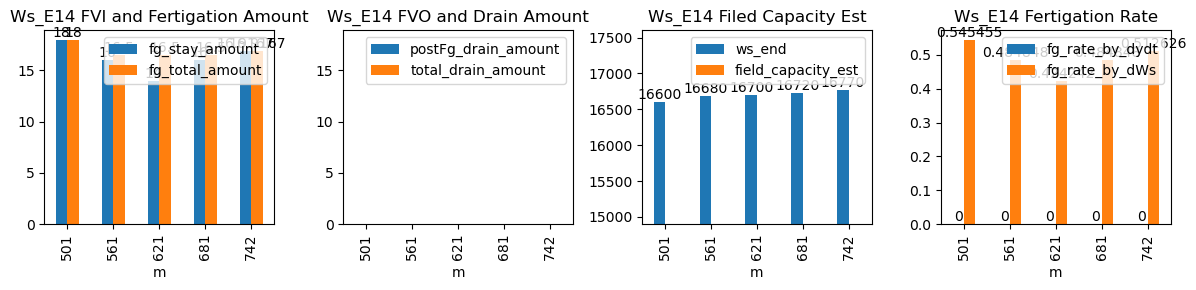
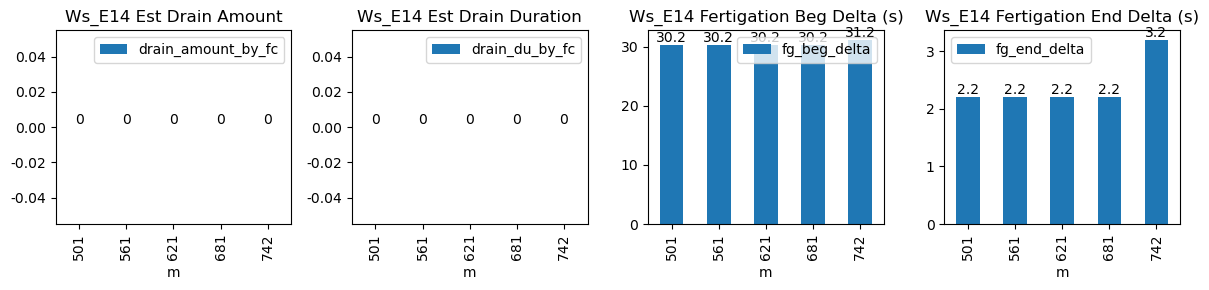
501 |
Ws_E14 |
3.24912 |
30 |
501.08 |
501.583333 |
501.63 |
501.666667 |
NaN |
NaN |
NaN |
16510.000000 |
16600.0 |
33 |
0.0 |
0.000000 |
0.000000 |
NaN |
0.545455 |
18.000000 |
30.2 |
2.2 |
18.000000 |
0.0 |
-18.000000 |
NaN |
-18.000000 |
| 2025-11-18 09:21:05+08:00 |
43 |
561 |
Ws_E14 |
3.24912 |
30 |
561.08 |
561.583333 |
561.63 |
561.666667 |
NaN |
NaN |
NaN |
16600.000000 |
16680.0 |
33 |
0.0 |
-0.204167 |
0.000000 |
NaN |
0.484848 |
16.000000 |
30.2 |
2.2 |
16.500000 |
0.5 |
-6.000000 |
NaN |
-5.500000 |
| 2025-11-18 10:21:05+08:00 |
43 |
621 |
Ws_E14 |
3.24912 |
30 |
621.08 |
621.583333 |
621.63 |
621.666667 |
NaN |
NaN |
NaN |
16630.000000 |
16700.0 |
33 |
0.0 |
-0.325000 |
-0.034375 |
NaN |
0.424242 |
14.000000 |
30.2 |
2.2 |
16.500000 |
2.5 |
-5.244356 |
NaN |
-2.744356 |
| 2025-11-18 11:21:05+08:00 |
43 |
681 |
Ws_E14 |
3.24912 |
30 |
681.08 |
681.583333 |
681.63 |
681.666667 |
NaN |
NaN |
NaN |
16640.000000 |
16720.0 |
33 |
0.0 |
-0.138889 |
-0.041667 |
NaN |
0.484848 |
16.000000 |
30.2 |
2.2 |
16.500000 |
0.5 |
-9.508310 |
NaN |
-9.008310 |
| 2025-11-18 12:22:14+08:00 |
43 |
742 |
Ws_E14 |
3.24912 |
30 |
742.23 |
742.750000 |
742.78 |
742.833333 |
NaN |
NaN |
NaN |
16685.416667 |
16770.0 |
33 |
0.0 |
-0.245833 |
0.000000 |
NaN |
0.512626 |
16.916667 |
31.2 |
3.2 |
16.916667 |
0.0 |
-4.916667 |
NaN |
-4.916667 |