| 2025-11-19 08:31:05+08:00 |
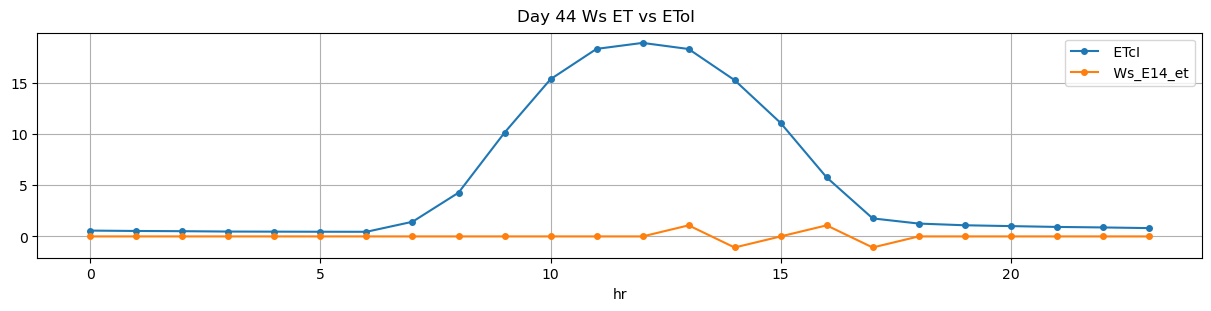
44 |
511 |
Ws_E14 |
1.861777 |
30 |
511.08 |
511.583333 |
511.63 |
511.666667 |
NaN |
NaN |
NaN |
16710.0 |
16800.0 |
33 |
0.0 |
0.000000 |
0.0 |
NaN |
0.545455 |
18.0 |
30.2 |
2.2 |
18.0 |
0.0 |
-18.0 |
NaN |
-18.0 |
| 2025-11-19 09:31:05+08:00 |
44 |
571 |
Ws_E14 |
1.861777 |
30 |
571.08 |
571.583333 |
571.63 |
571.666667 |
NaN |
NaN |
NaN |
16800.0 |
16890.0 |
33 |
0.0 |
0.000000 |
0.0 |
NaN |
0.545455 |
18.0 |
30.2 |
2.2 |
18.0 |
0.0 |
-14.0 |
NaN |
-14.0 |
| 2025-11-19 10:31:05+08:00 |
44 |
631 |
Ws_E14 |
1.861777 |
30 |
631.08 |
631.583333 |
631.63 |
631.666667 |
NaN |
NaN |
NaN |
16870.0 |
16940.0 |
33 |
0.0 |
-0.050000 |
0.0 |
NaN |
0.424242 |
14.0 |
30.2 |
2.2 |
16.5 |
2.5 |
-8.0 |
NaN |
-5.5 |
| 2025-11-19 11:31:05+08:00 |
44 |
691 |
Ws_E14 |
1.861777 |
30 |
691.08 |
691.583333 |
691.63 |
691.666667 |
NaN |
NaN |
NaN |
16910.0 |
16980.0 |
33 |
0.0 |
-0.179167 |
0.0 |
NaN |
0.424242 |
14.0 |
30.2 |
2.2 |
16.5 |
2.5 |
-6.0 |
NaN |
-3.5 |