| 2025-11-17 07:26:02+08:00 |
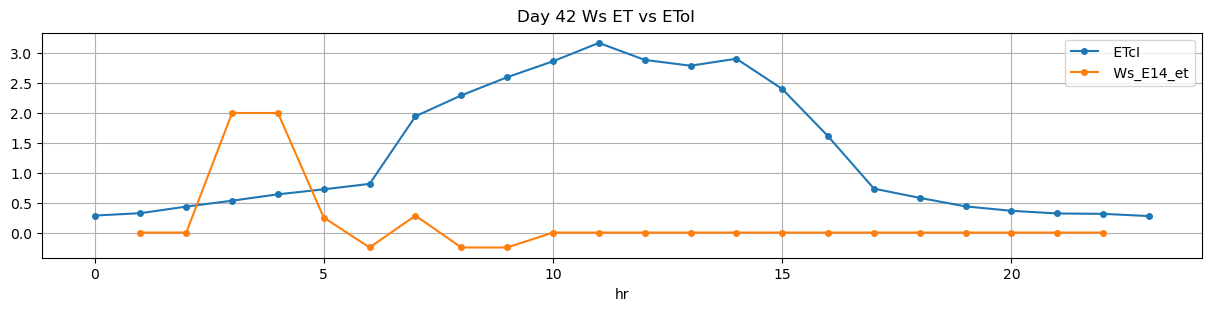
42 |
446 |
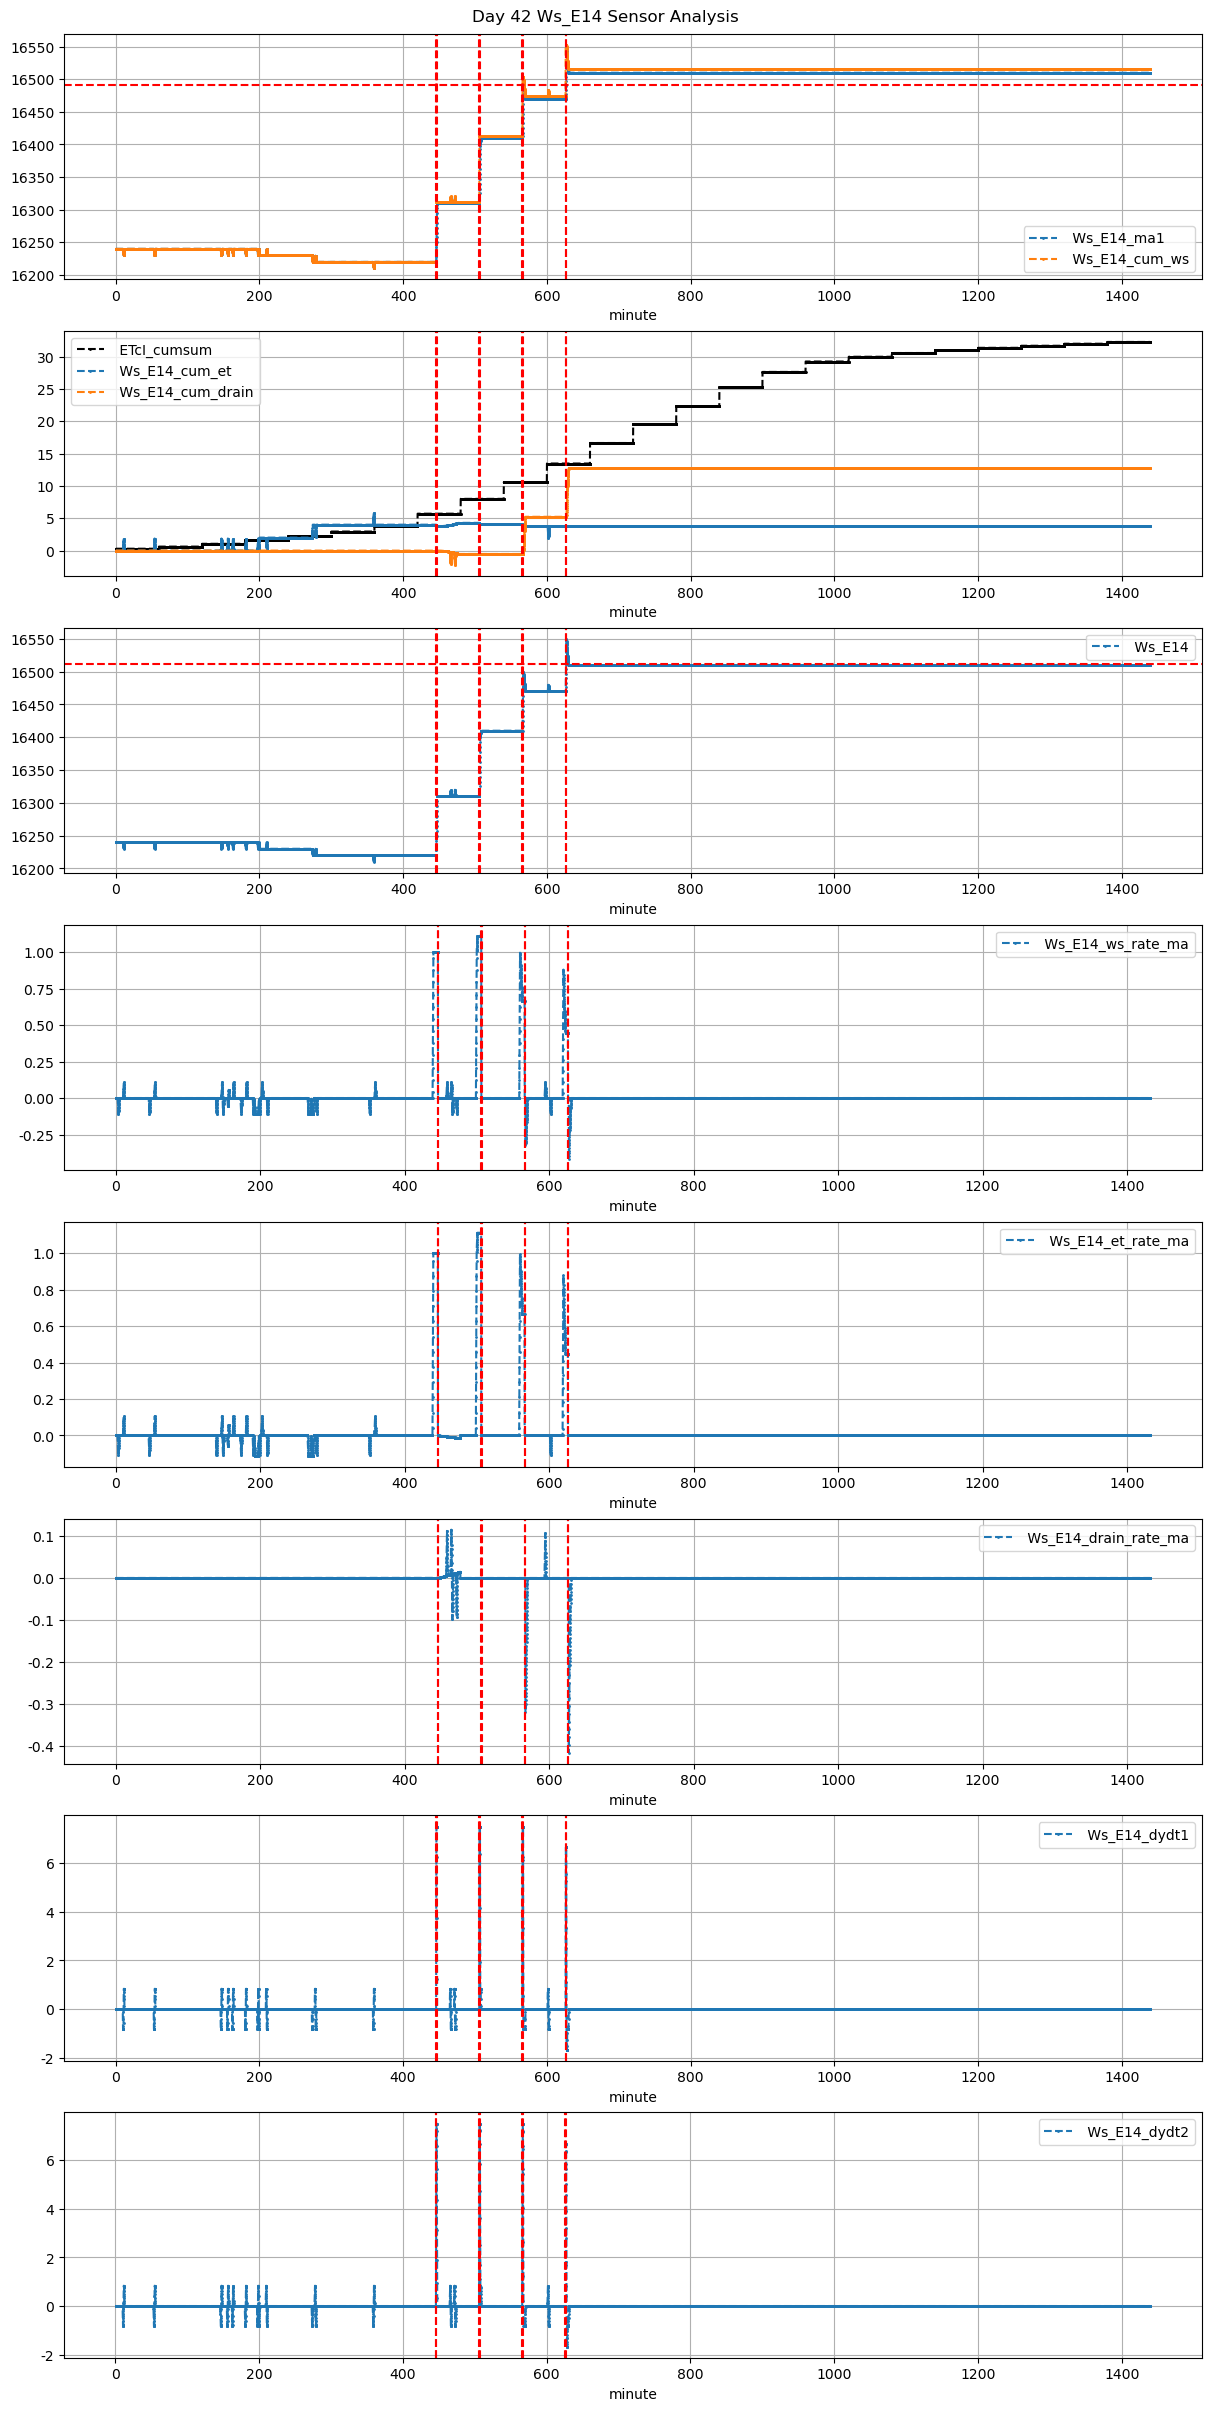
Ws_E14 |
0.494168 |
30 |
446.03 |
446.083333 |
446.58 |
447.083333 |
16220.0 |
16310.0 |
33 |
0.0 |
0.000000 |
-0.019329 |
0.300000 |
0.545455 |
18.0 |
True |
3.2 |
30.2 |
19.959677 |
0.000000 |
0.000000 |
0.000000 |
60.0 |
1180.0 |
-0.820883 |
NaN |
NaN |
NaN |
| 2025-11-17 08:26:02+08:00 |
42 |
506 |
Ws_E14 |
0.494168 |
30 |
506.03 |
506.083333 |
506.58 |
508.083333 |
16310.0 |
16410.0 |
33 |
0.0 |
0.000000 |
0.000000 |
0.287778 |
0.606061 |
20.0 |
True |
3.2 |
90.2 |
20.000000 |
0.000000 |
0.000000 |
0.000000 |
NaN |
NaN |
NaN |
NaN |
NaN |
NaN |
| 2025-11-17 09:26:02+08:00 |
42 |
566 |
Ws_E14 |
0.494168 |
30 |
566.03 |
566.083333 |
566.58 |
567.083333 |
16410.0 |
16500.0 |
33 |
0.0 |
-0.157292 |
0.000000 |
0.300000 |
0.545455 |
18.0 |
True |
3.2 |
30.2 |
19.959677 |
0.000000 |
0.000000 |
0.000000 |
180.0 |
40.0 |
-0.833333 |
NaN |
NaN |
NaN |
| 2025-11-17 10:26:02+08:00 |
42 |
626 |
Ws_E14 |
0.494168 |
30 |
626.03 |
626.166667 |
626.58 |
627.166667 |
16470.0 |
16550.0 |
33 |
0.0 |
-0.176852 |
0.000000 |
0.266667 |
0.484848 |
16.0 |
True |
8.2 |
35.2 |
19.959677 |
3.777778 |
7.555556 |
11.333333 |
175.0 |
50.0 |
-1.666667 |
16512.222222 |
NaN |
NaN |