| 2025-11-16 08:21:05+08:00 |
41 |
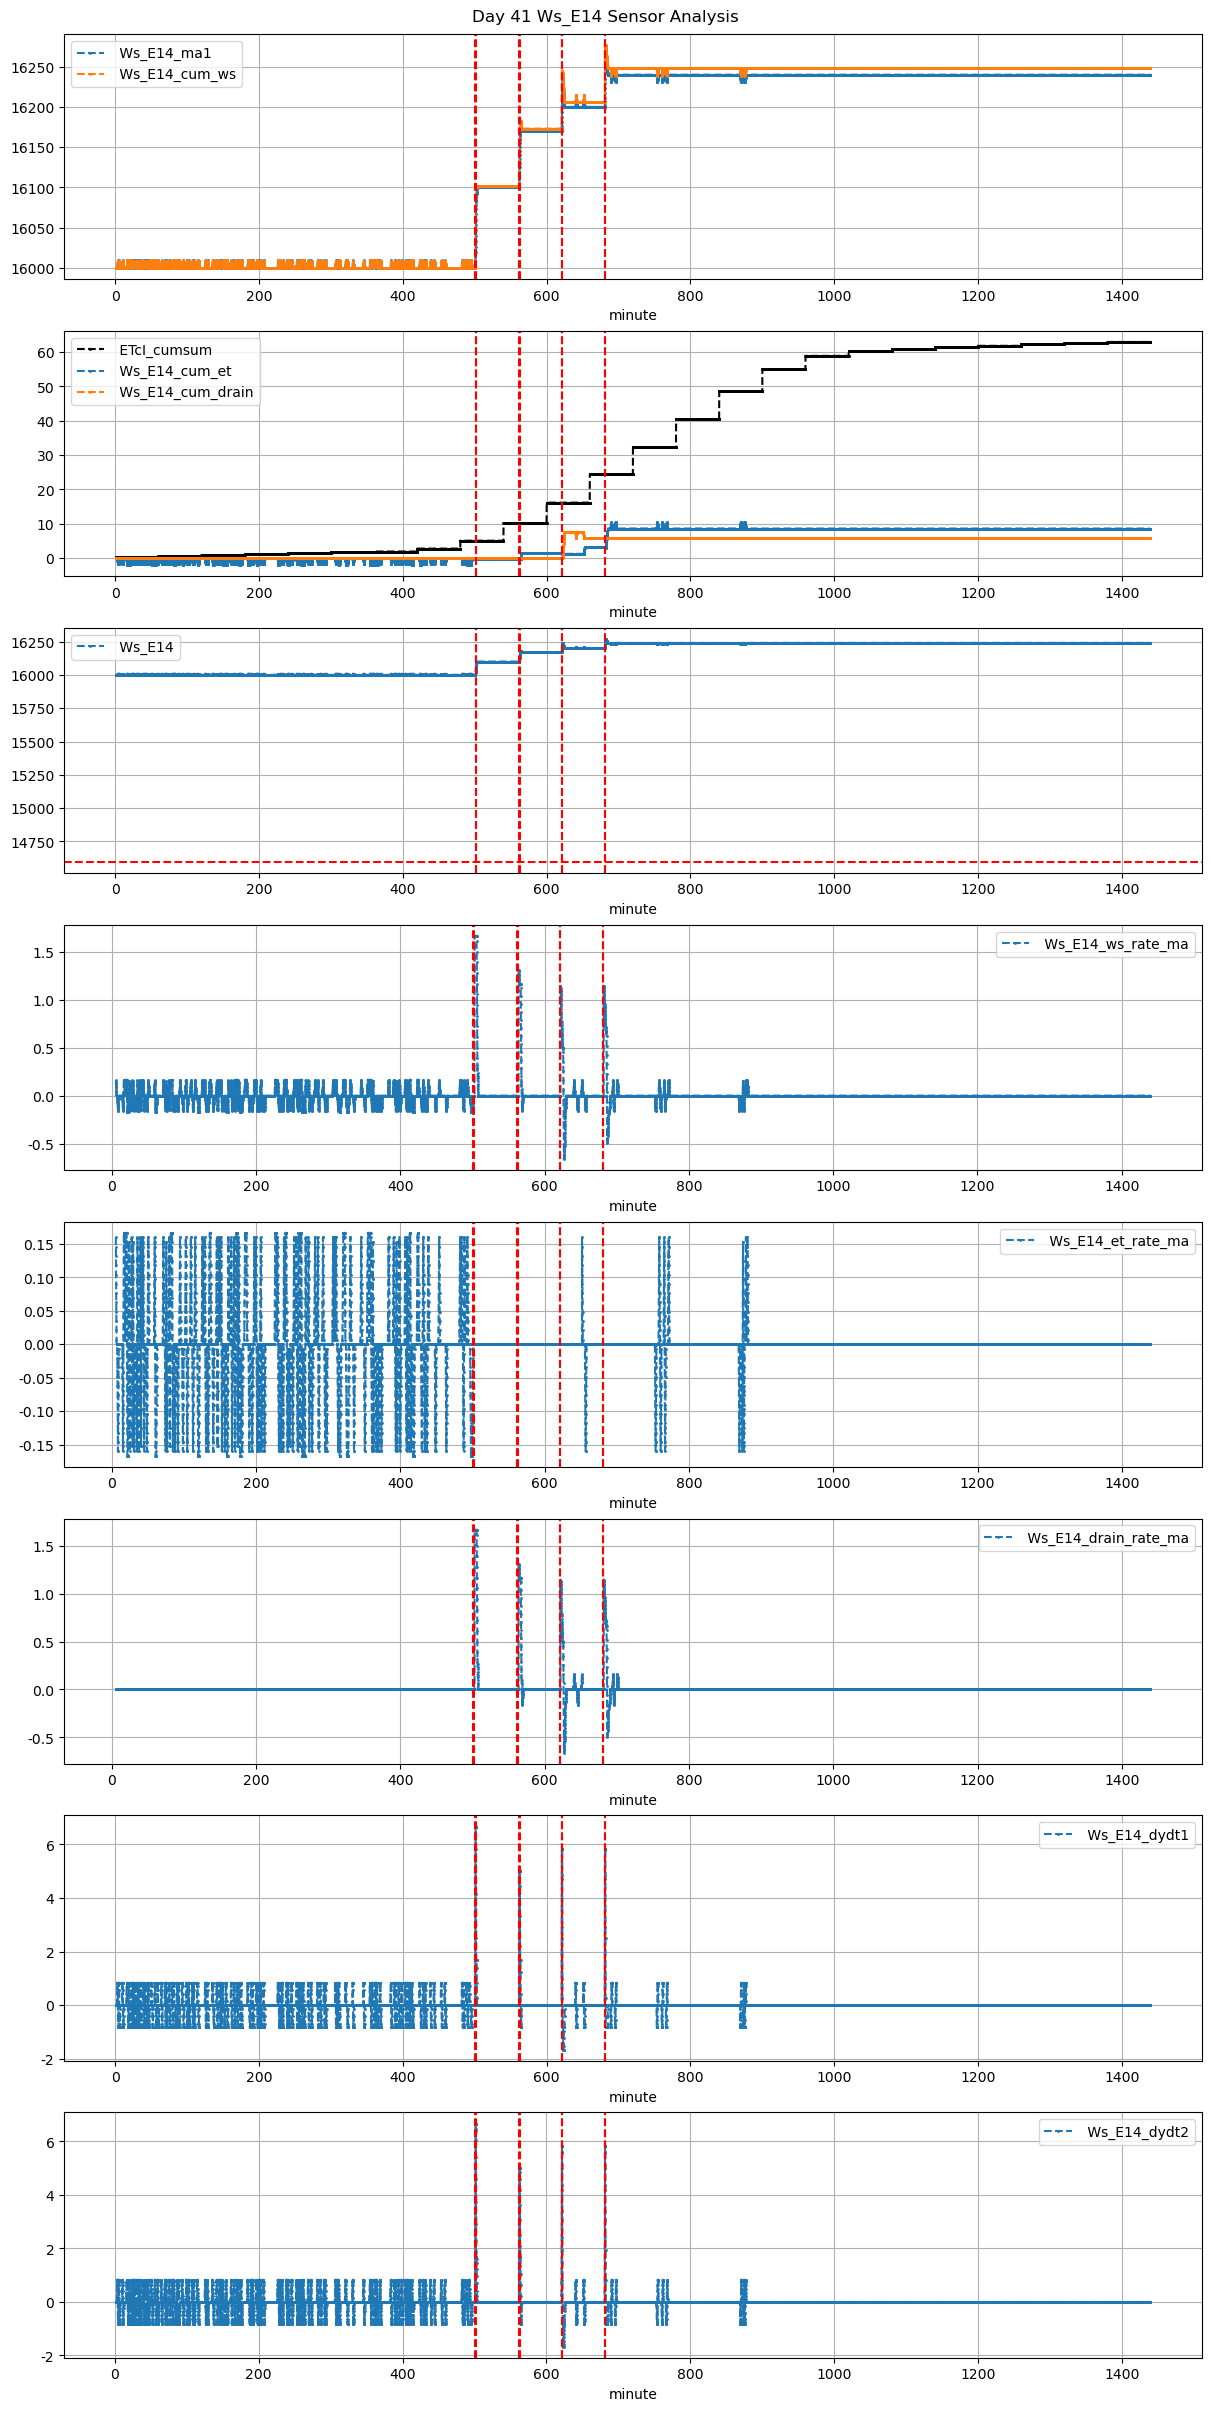
501 |
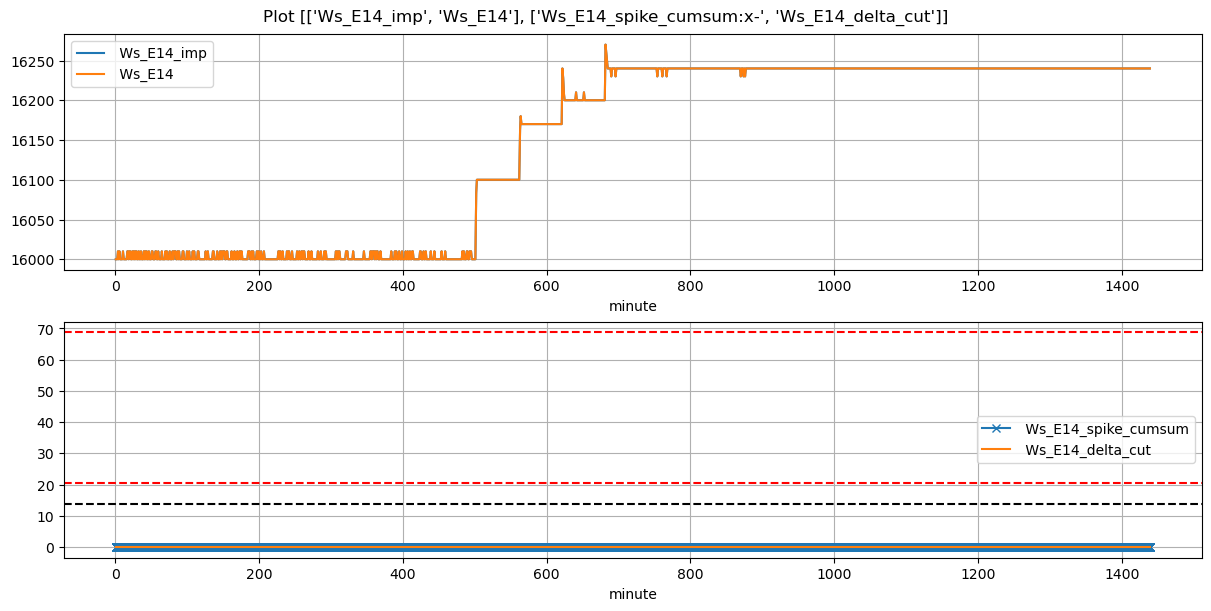
Ws_E14 |
1.023838 |
30 |
501.08 |
500.916667 |
501.63 |
502.916667 |
16000.0 |
16100.0 |
33 |
-0.101695 |
0.000000 |
0.0 |
0.256111 |
0.606061 |
20.0 |
True |
-9.8 |
77.2 |
20.0 |
0.0 |
0.000000 |
0.000000 |
NaN |
NaN |
NaN |
NaN |
NaN |
NaN |
| 2025-11-16 09:22:12+08:00 |
41 |
562 |
Ws_E14 |
1.023838 |
30 |
562.20 |
561.916667 |
562.75 |
563.916667 |
16100.0 |
16180.0 |
33 |
0.000000 |
-0.019213 |
0.0 |
0.192222 |
0.484848 |
16.0 |
True |
-17.0 |
70.0 |
20.0 |
0.0 |
0.000000 |
0.000000 |
55.0 |
84.0 |
-0.833333 |
NaN |
NaN |
NaN |
| 2025-11-16 10:21:05+08:00 |
41 |
621 |
Ws_E14 |
1.023838 |
30 |
621.08 |
620.916667 |
621.63 |
621.916667 |
16170.0 |
16240.0 |
33 |
0.000000 |
-0.210301 |
0.0 |
0.233333 |
0.424242 |
14.0 |
True |
-9.8 |
17.2 |
20.0 |
0.0 |
6.277778 |
6.277778 |
120.0 |
87.0 |
-1.666667 |
NaN |
NaN |
NaN |
| 2025-11-16 11:21:05+08:00 |
41 |
681 |
Ws_E14 |
1.023838 |
30 |
681.08 |
680.916667 |
681.63 |
681.916667 |
16200.0 |
16270.0 |
33 |
0.000000 |
-0.190856 |
0.0 |
0.233333 |
0.424242 |
14.0 |
True |
-9.8 |
17.2 |
20.0 |
0.0 |
0.000000 |
0.000000 |
135.0 |
72.0 |
-0.833333 |
NaN |
NaN |
NaN |