| 2025-11-19 08:31:05+08:00 |
44 |
511 |
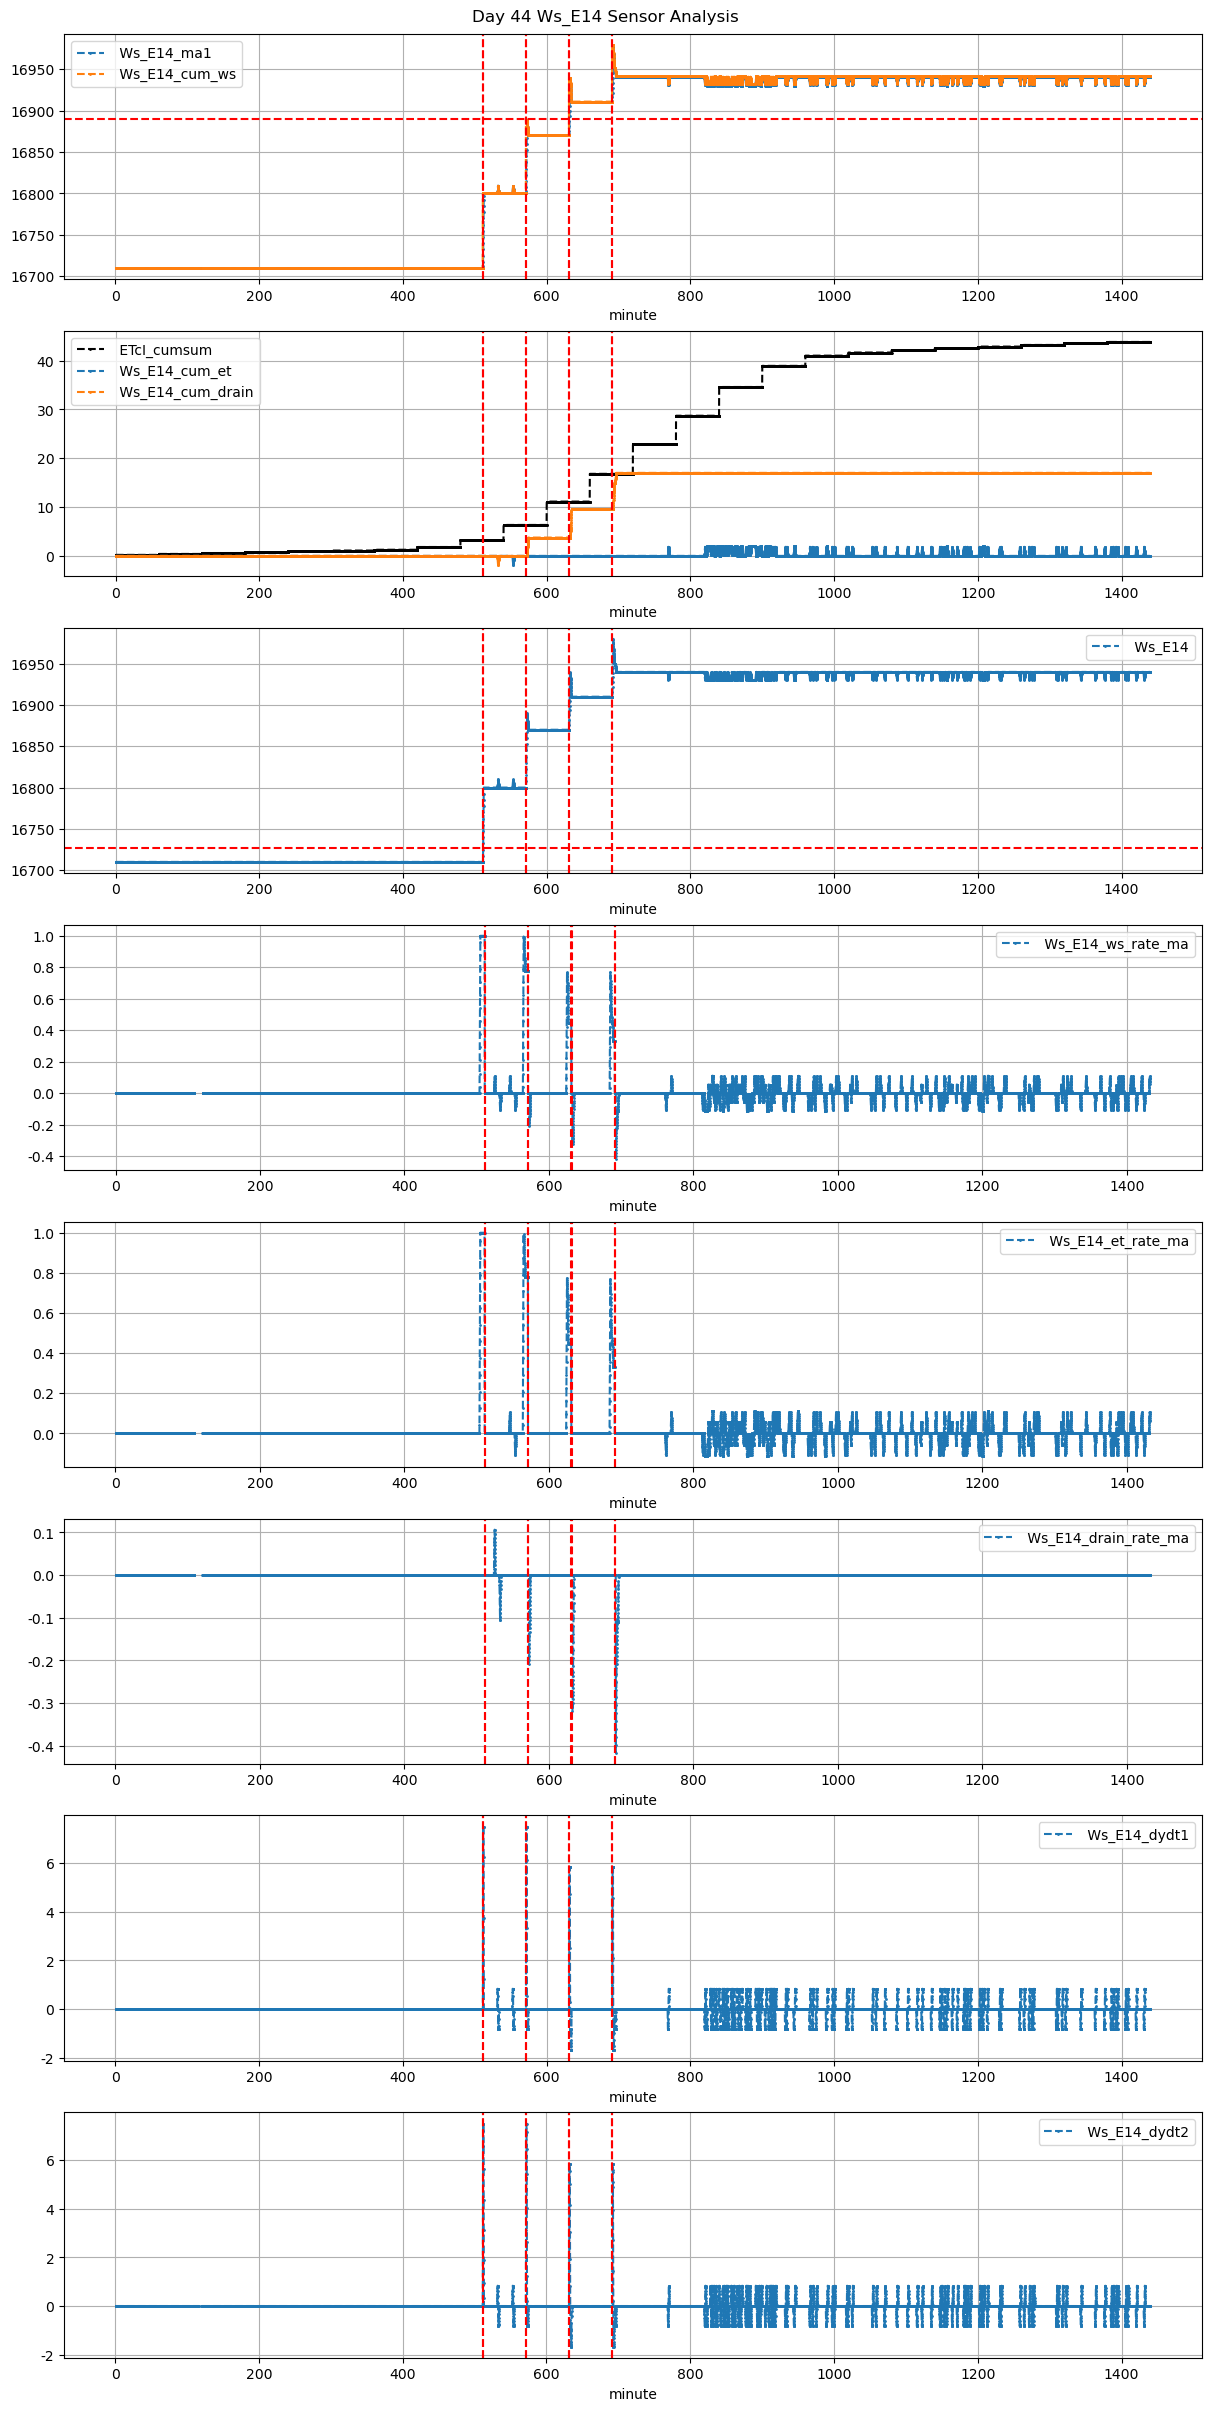
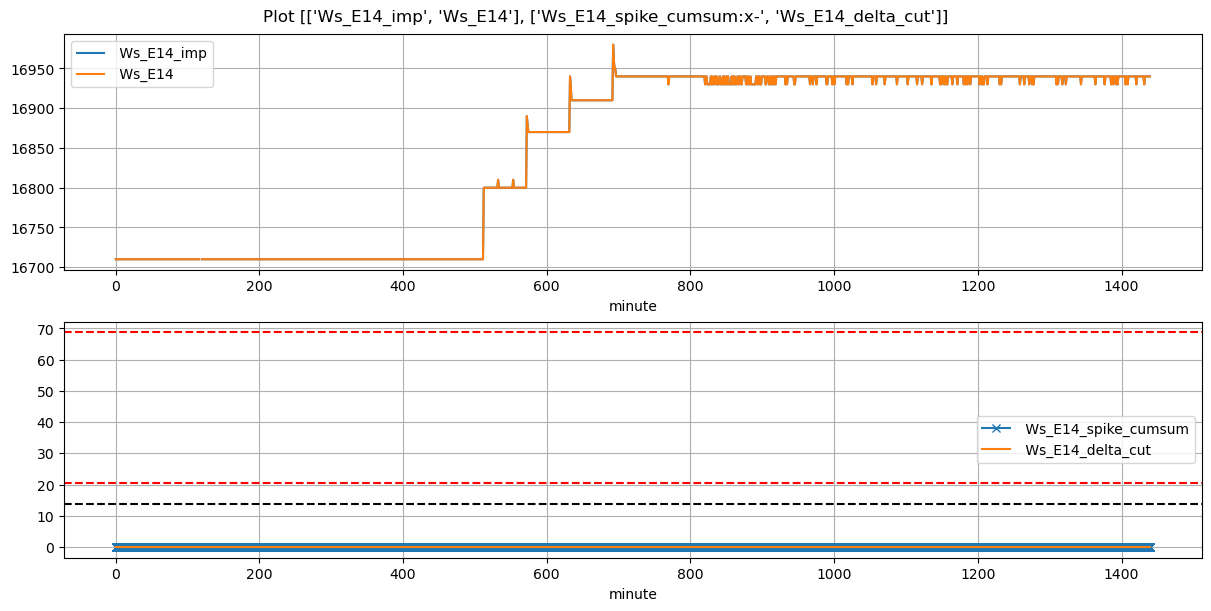
Ws_E14 |
1.522373 |
30 |
511.08 |
511.416667 |
511.63 |
512.500000 |
16710.0 |
16800.000000 |
33 |
0.0 |
0.000000 |
0.0 |
0.300000 |
0.545455 |
18.000000 |
True |
20.2 |
52.2 |
18.000 |
0.000 |
1.861111 |
1.861111 |
65 |
1247 |
-0.105093 |
16790.694444 |
NaN |
NaN |
| 2025-11-19 09:31:05+08:00 |
44 |
571 |
Ws_E14 |
1.522373 |
30 |
571.08 |
571.416667 |
571.63 |
572.500000 |
16800.0 |
16889.166667 |
33 |
0.0 |
-0.029630 |
0.0 |
0.300000 |
0.540404 |
17.833333 |
True |
20.2 |
52.2 |
17.985 |
0.200 |
3.750000 |
3.950000 |
114 |
57 |
-0.198148 |
16870.416667 |
NaN |
NaN |
| 2025-11-19 10:31:05+08:00 |
44 |
631 |
Ws_E14 |
1.522373 |
30 |
631.08 |
631.500000 |
631.63 |
632.583333 |
16870.0 |
16939.166667 |
33 |
0.0 |
-0.051852 |
0.0 |
0.233333 |
0.419192 |
13.833333 |
True |
25.2 |
57.2 |
17.985 |
2.875 |
5.750000 |
8.625000 |
115 |
62 |
-0.309259 |
16910.416667 |
NaN |
NaN |
| 2025-11-19 11:31:05+08:00 |
44 |
691 |
Ws_E14 |
1.522373 |
30 |
691.08 |
691.500000 |
691.63 |
692.583333 |
16910.0 |
16978.333333 |
33 |
0.0 |
-0.088889 |
0.0 |
0.233333 |
0.414141 |
13.666667 |
True |
25.2 |
57.2 |
17.985 |
3.750 |
7.500000 |
11.250000 |
235 |
62 |
-0.374074 |
16940.833333 |
NaN |
NaN |