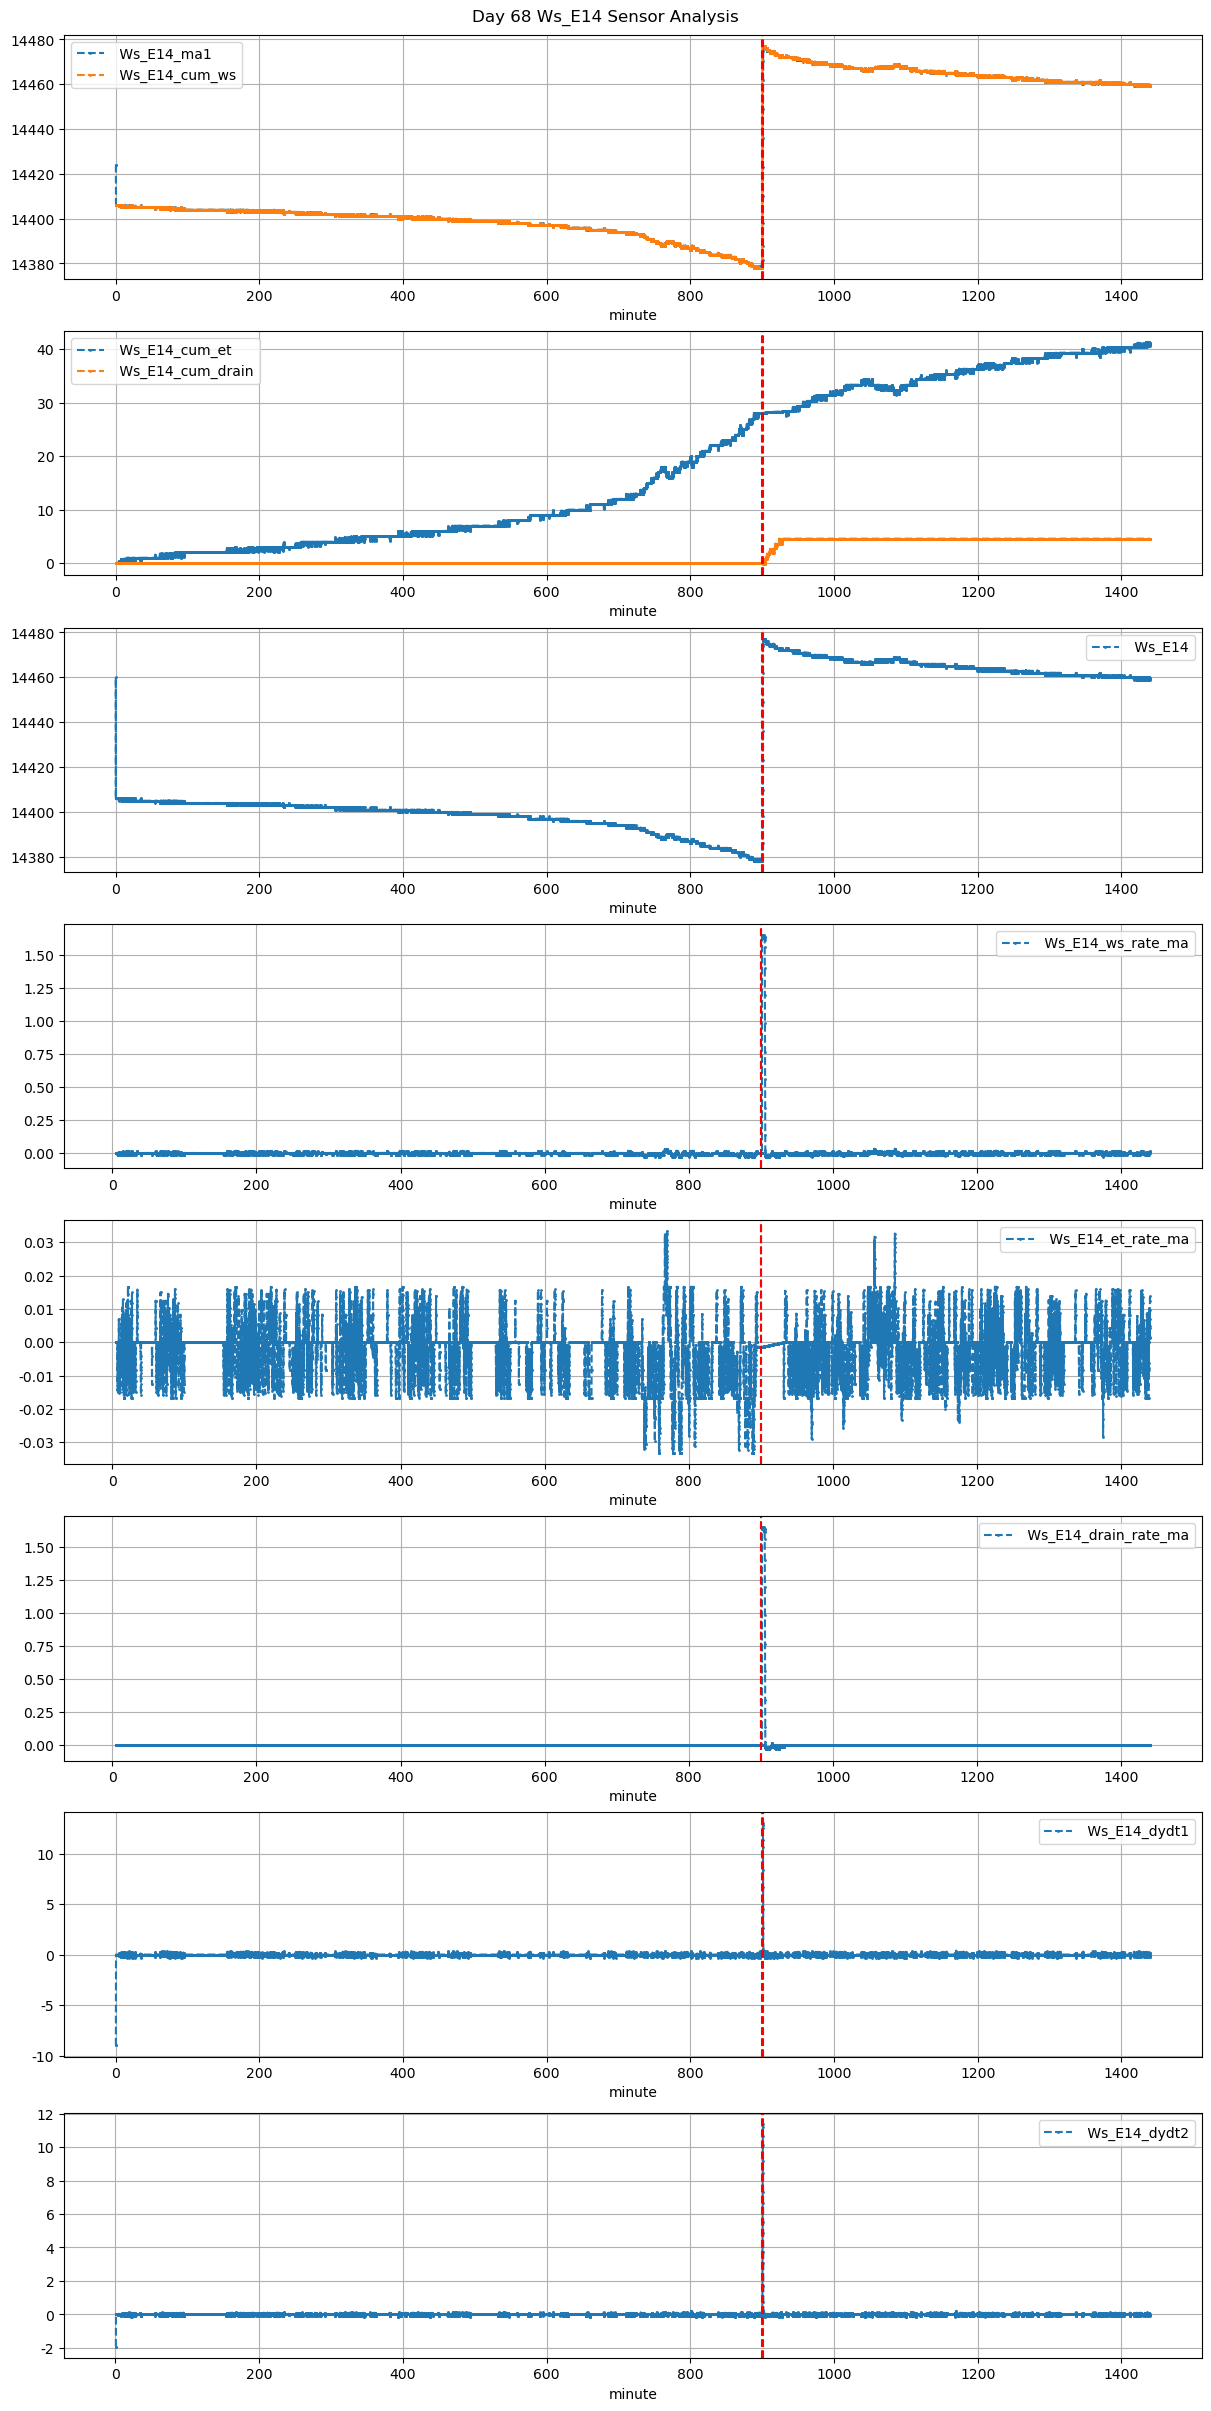
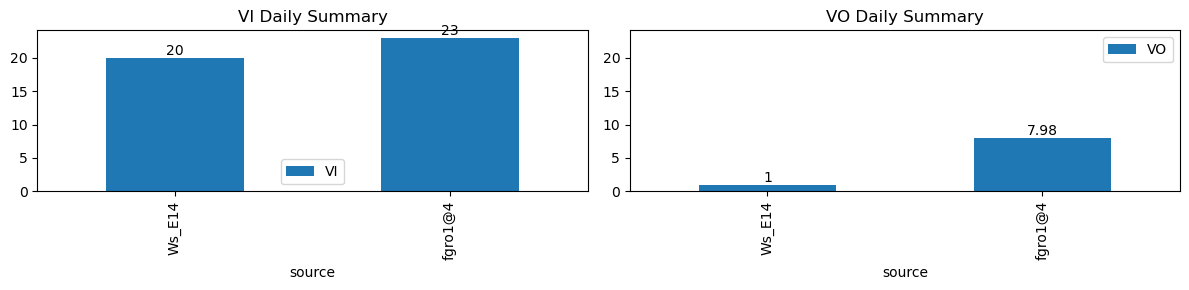
VI and VO Daily Summary
| ws_name | total_dp | nan_dp | nan_filled_dp | long_gap_dp | num_spike |
|---|---|---|---|---|---|
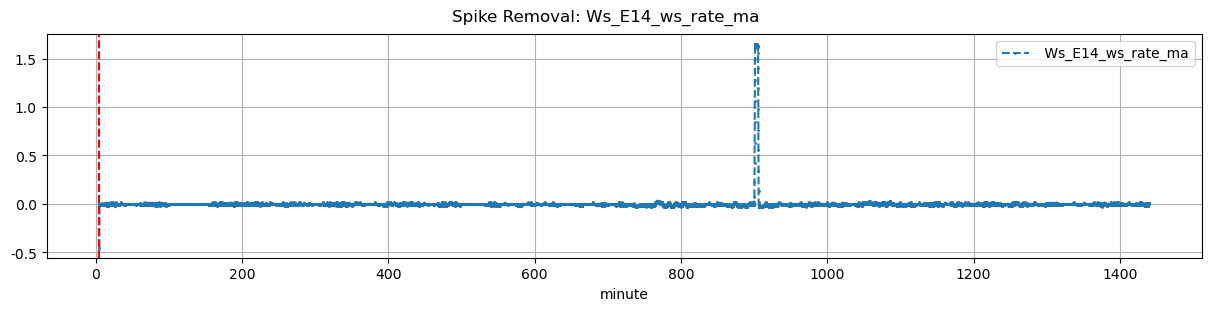
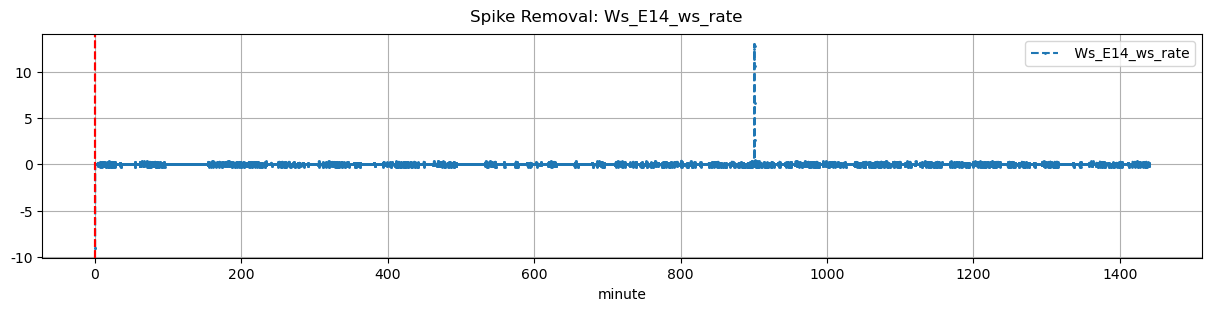
| Ws_E14 | 17281 | 0 | 14067 | 0 | 0 |
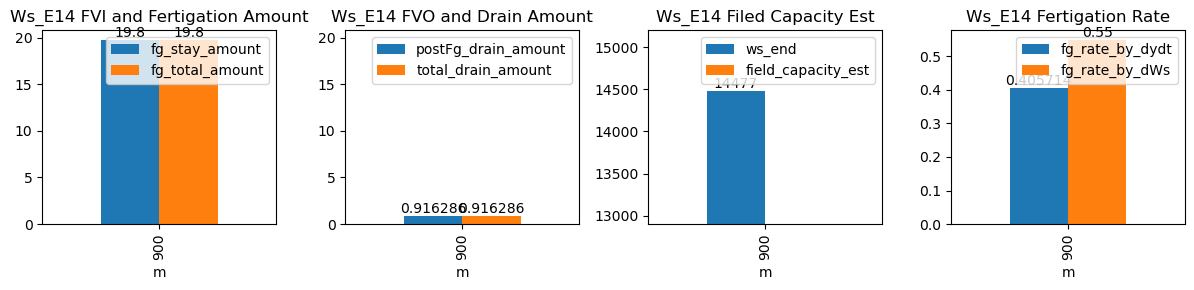
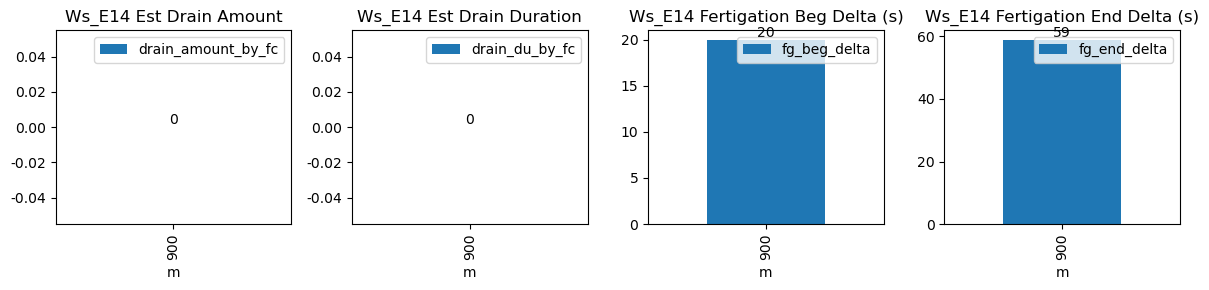
| ds | d | m | ws_name | prominence_cut | max_drain_du | fg_beg | fg_beg_est | fg_end | fg_end_est | drain_amount_by_fc | drain_du_by_fc | drain_rate_by_fc | ws_beg | ws_end | duc | pre_fg_et | post_fg_ws | post_drn_et | fg_rate_by_dydt | fg_rate_by_dWs | fg_stay_amount | fg_beg_delta | fg_end_delta | fg_total_amount | fg_drain_amount | postFg_drain_amount | field_capacity_est | total_drain_amount |
|---|---|---|---|---|---|---|---|---|---|---|---|---|---|---|---|---|---|---|---|---|---|---|---|---|---|---|---|---|
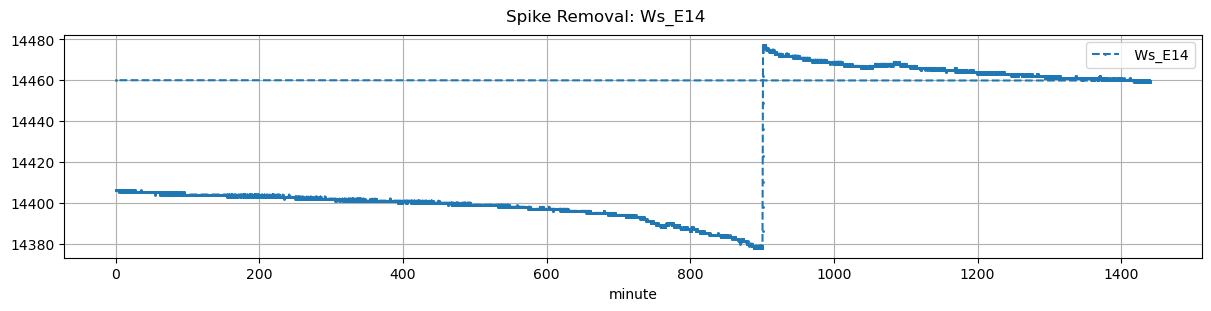
| 2025-12-13 15:00:00+08:00 | 68 | 900 | Ws_E14 | 0.200876 | 30 | 900.0 | 900.333333 | 900.6 | 901.583333 | NaN | NaN | NaN | 14378.0 | 14477.0 | 36 | -0.001401 | -0.02625 | 0.0 | 0.405714 | 0.55 | 19.8 | 20.0 | 59.0 | 19.8 | 0.0 | 0.916286 | NaN | 0.916286 |