| 2026-01-13 10:05:00+08:00 |
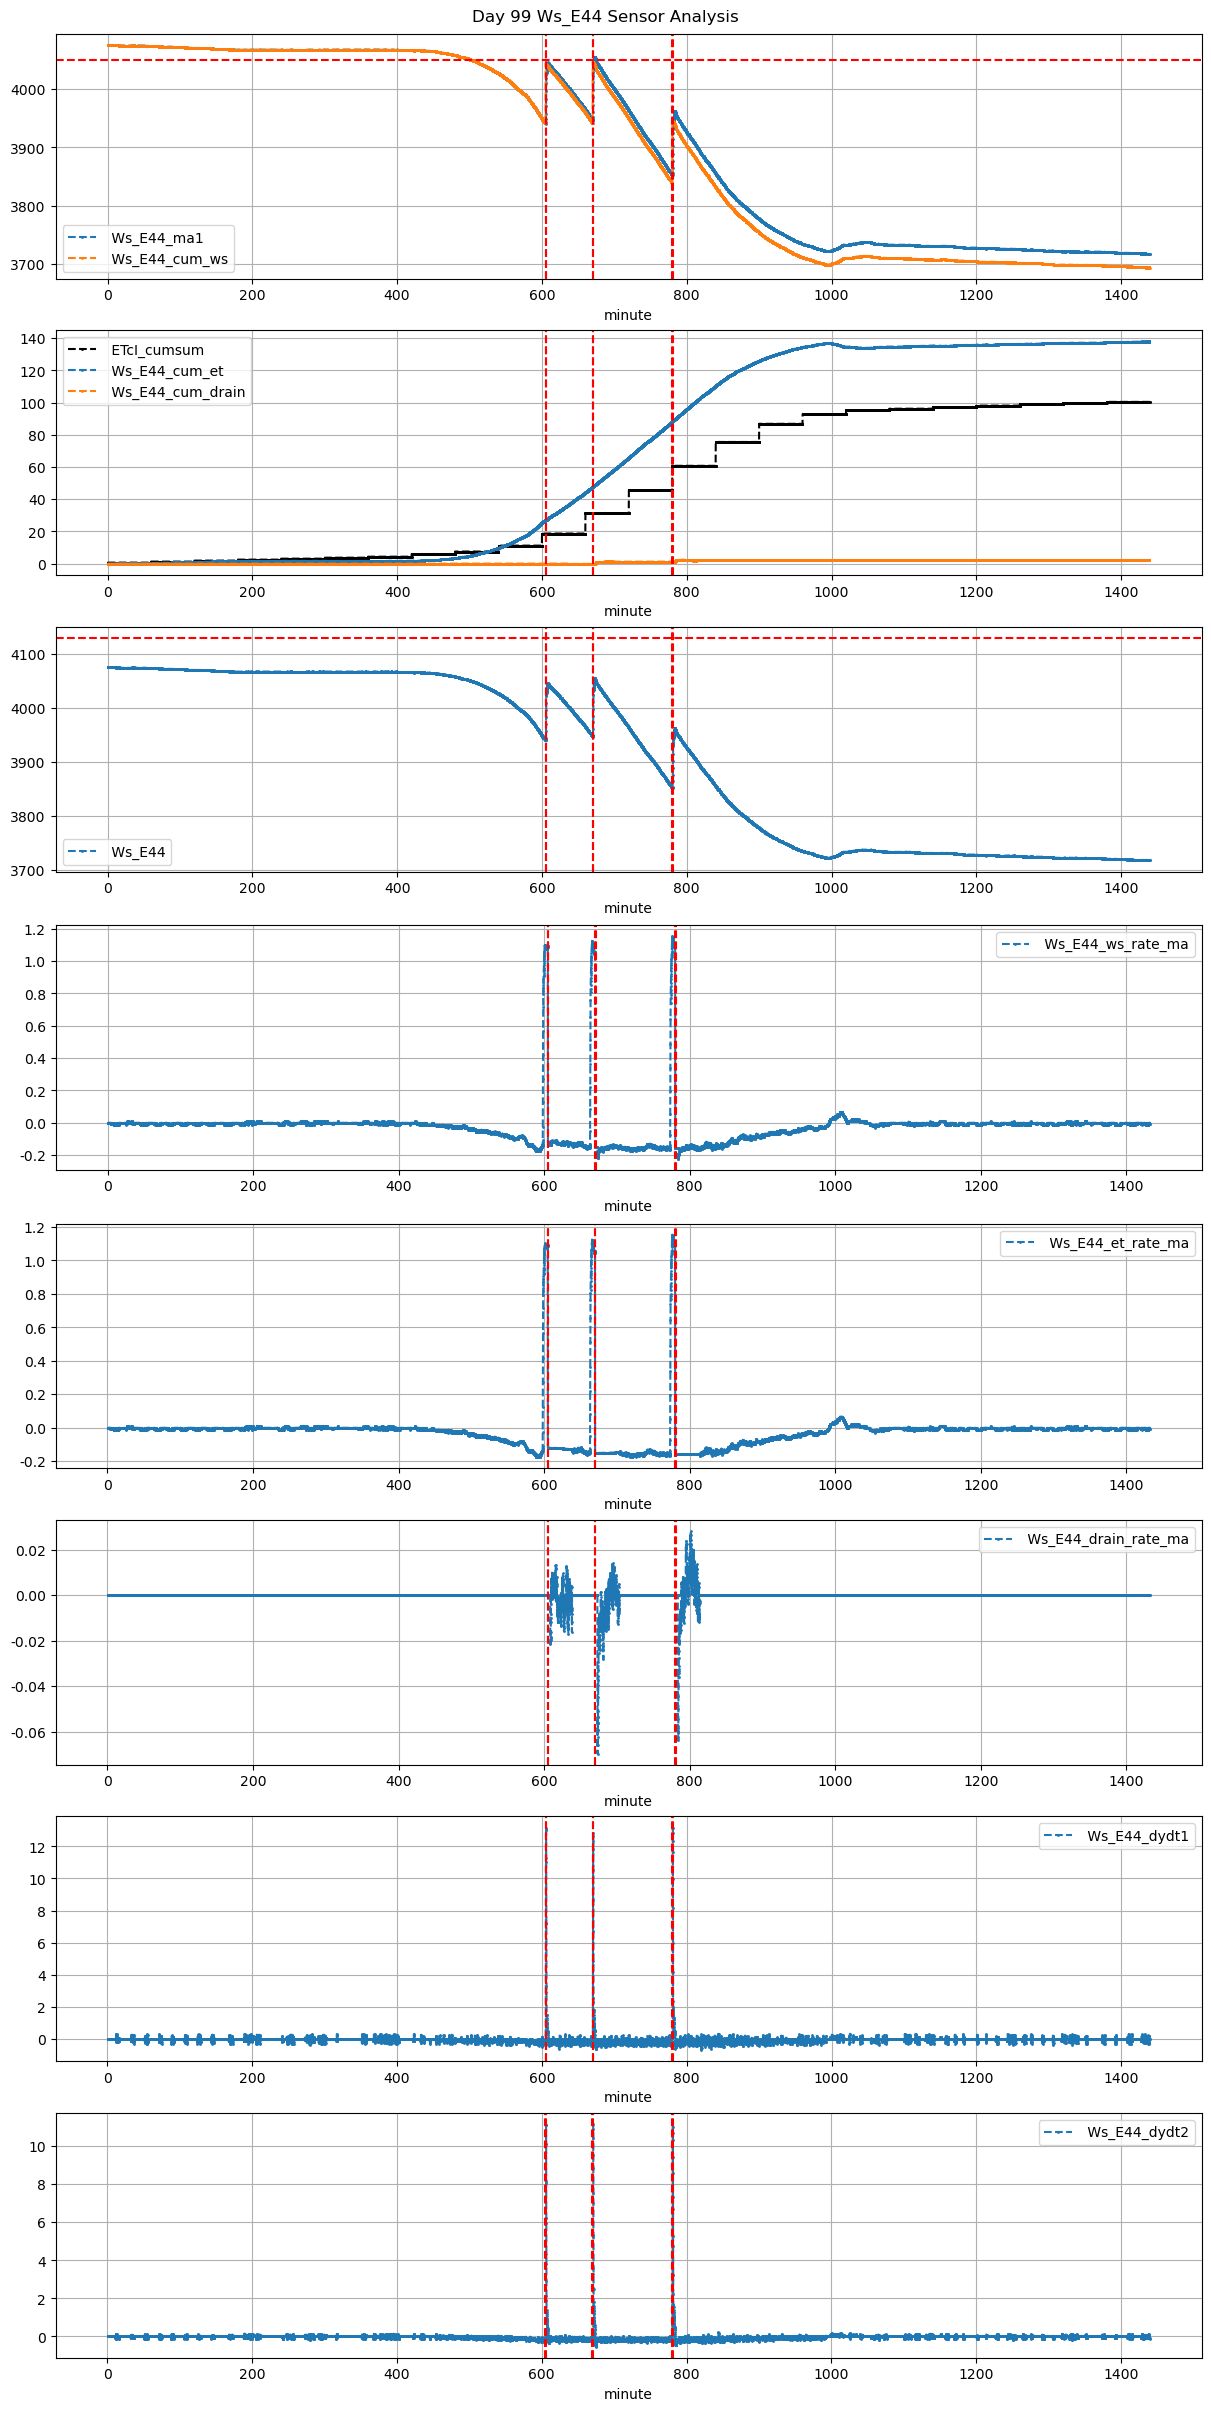
99 |
605 |
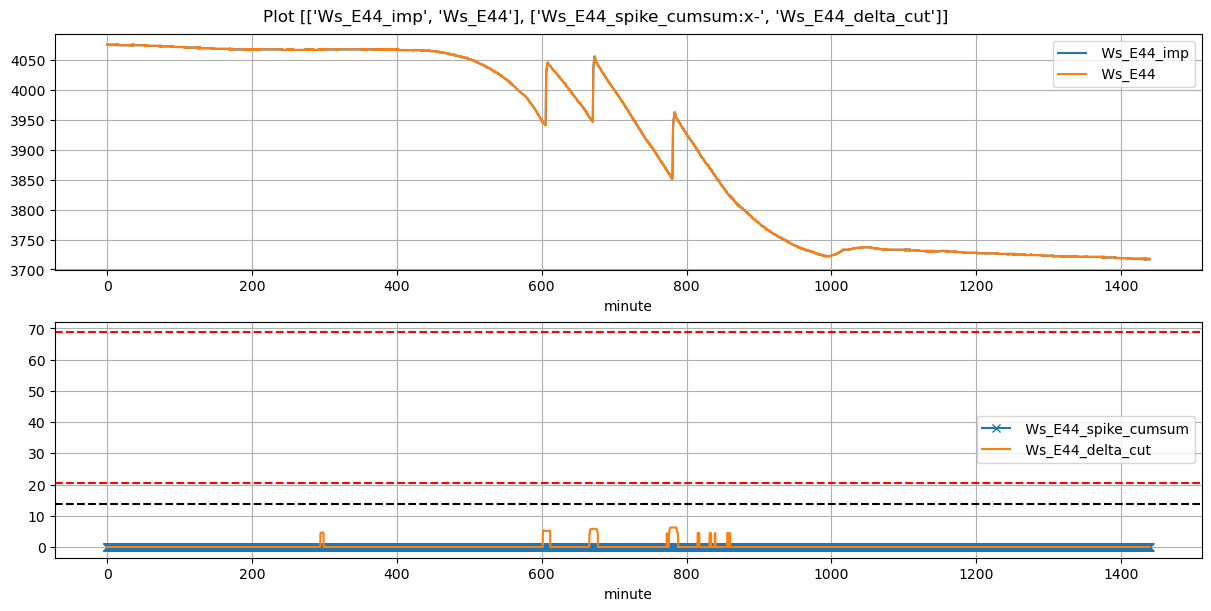
Ws_E44 |
0.358822 |
30 |
605.0 |
605.5 |
605.53 |
608.250000 |
3943.657143 |
4045.962963 |
32 |
-0.161032 |
-0.117892 |
-0.128011 |
0.243639 |
0.639411 |
20.461164 |
True |
30.0 |
163.2 |
20.461164 |
0.0 |
0.000000 |
0.000000 |
75 |
168 |
-0.017225 |
NaN |
NaN |
NaN |
| 2026-01-13 11:10:00+08:00 |
99 |
670 |
Ws_E44 |
0.358822 |
30 |
670.0 |
670.5 |
670.53 |
673.166667 |
3950.720000 |
4055.666667 |
32 |
-0.150614 |
-0.170593 |
-0.147179 |
0.254667 |
0.655917 |
20.989333 |
True |
30.0 |
158.2 |
20.989333 |
0.0 |
1.219354 |
1.219354 |
275 |
163 |
-0.052118 |
4049.569897 |
NaN |
NaN |
| 2026-01-13 13:00:00+08:00 |
99 |
780 |
Ws_E44 |
0.358822 |
30 |
780.0 |
780.5 |
780.53 |
783.666667 |
3854.825000 |
3962.822222 |
32 |
-0.158333 |
-0.174198 |
-0.159106 |
0.198089 |
0.674983 |
21.599444 |
True |
30.0 |
188.2 |
21.599444 |
0.0 |
0.000000 |
0.000000 |
280 |
203 |
-0.057909 |
NaN |
NaN |
NaN |