| 2026-01-03 10:15:00+08:00 |
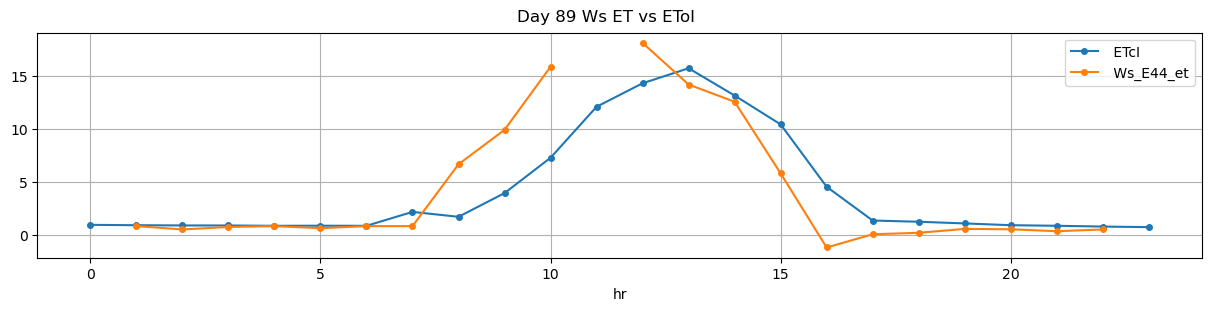
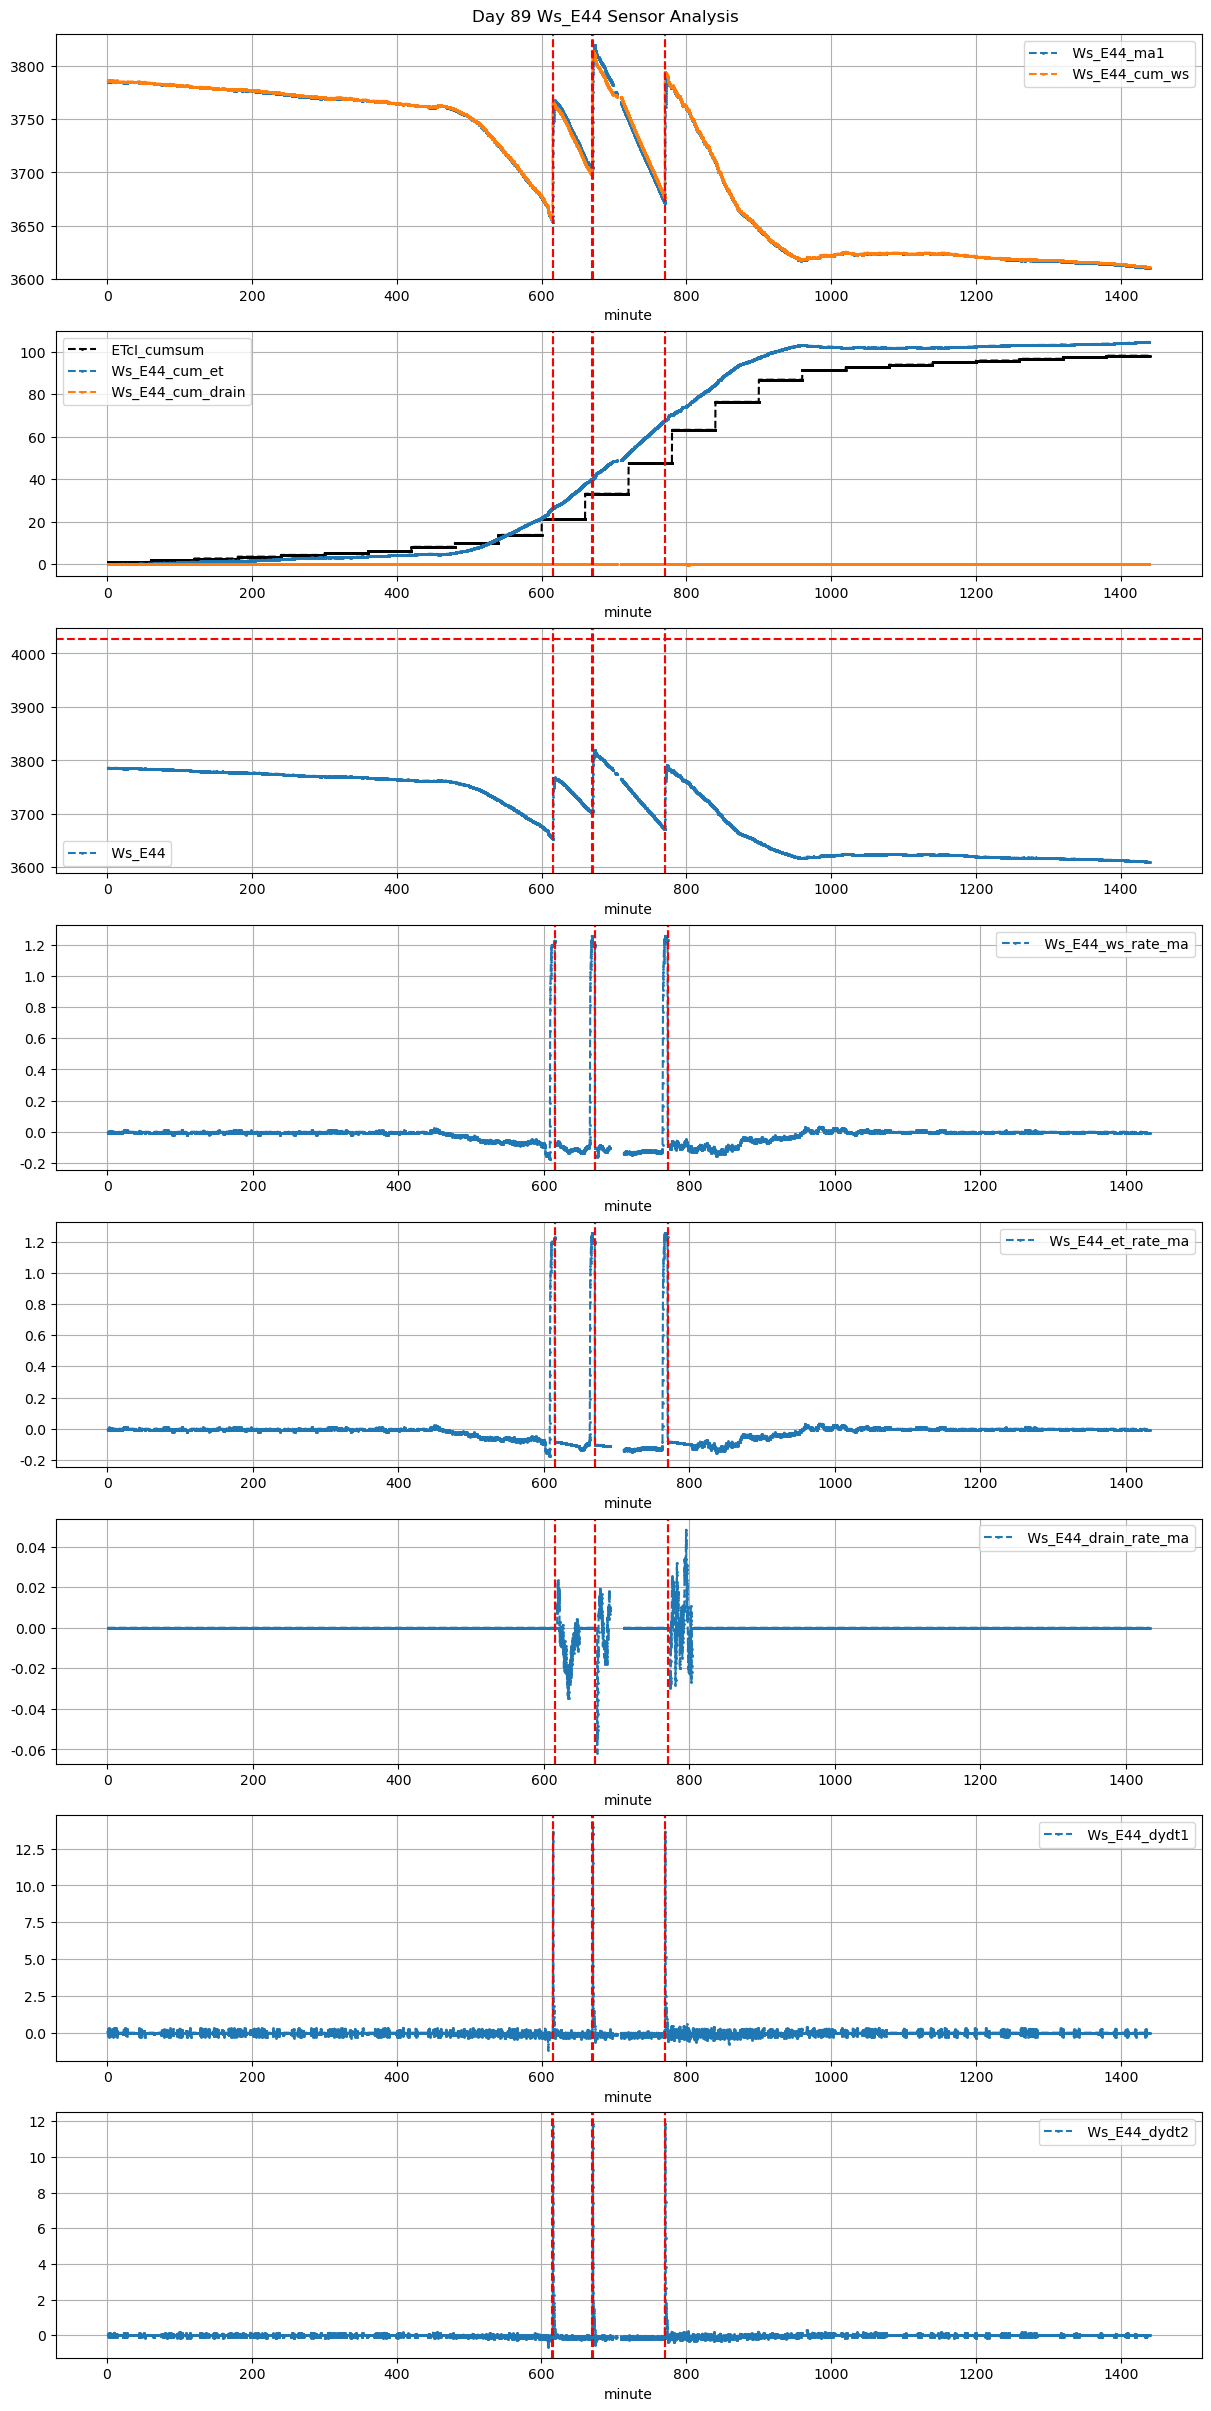
89 |
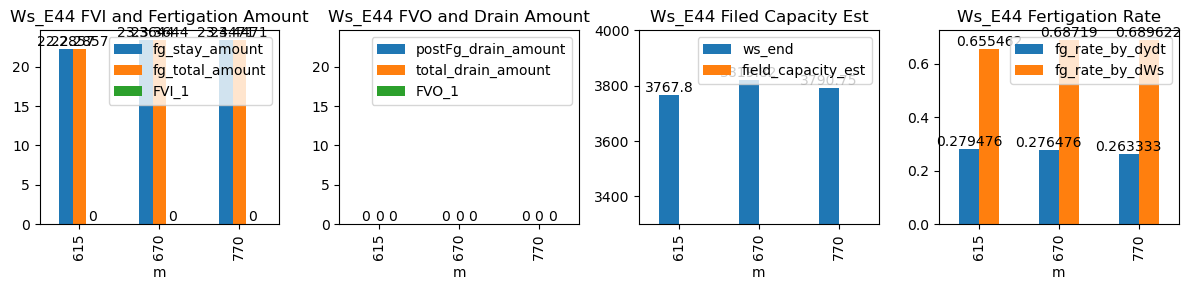
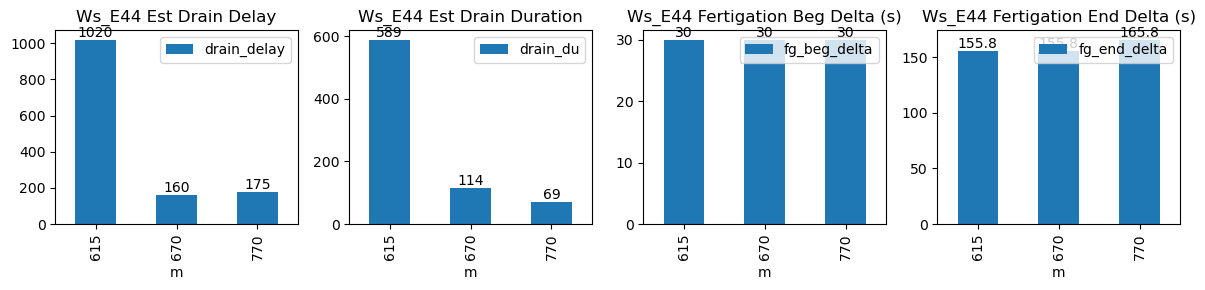
615 |
Ws_E44 |
0.311742 |
30 |
615.0 |
615.5 |
615.57 |
618.166667 |
3656.371429 |
3767.800000 |
34 |
-0.135398 |
-0.083901 |
-0.111963 |
0.279476 |
0.655462 |
22.285714 |
True |
30.0 |
155.8 |
22.285714 |
0.0 |
0 |
0.0 |
589 |
1020 |
-0.028848 |
NaN |
NaN |
NaN |
| 2026-01-03 11:10:00+08:00 |
89 |
670 |
Ws_E44 |
0.311742 |
30 |
670.0 |
670.5 |
670.57 |
673.166667 |
3703.000000 |
3819.822222 |
34 |
-0.102952 |
-0.106399 |
-0.113299 |
0.276476 |
0.687190 |
23.364444 |
True |
30.0 |
155.8 |
23.364444 |
0.0 |
0 |
0.0 |
114 |
160 |
-0.050456 |
NaN |
NaN |
NaN |
| 2026-01-03 12:50:00+08:00 |
89 |
770 |
Ws_E44 |
0.311742 |
30 |
770.0 |
770.5 |
770.57 |
773.333333 |
3673.514286 |
3790.750000 |
34 |
-0.128664 |
-0.082747 |
-0.101958 |
0.263333 |
0.689622 |
23.447143 |
True |
30.0 |
165.8 |
23.447143 |
0.0 |
0 |
0.0 |
69 |
175 |
-0.026547 |
NaN |
NaN |
NaN |