| 2026-01-02 10:50:00+08:00 |
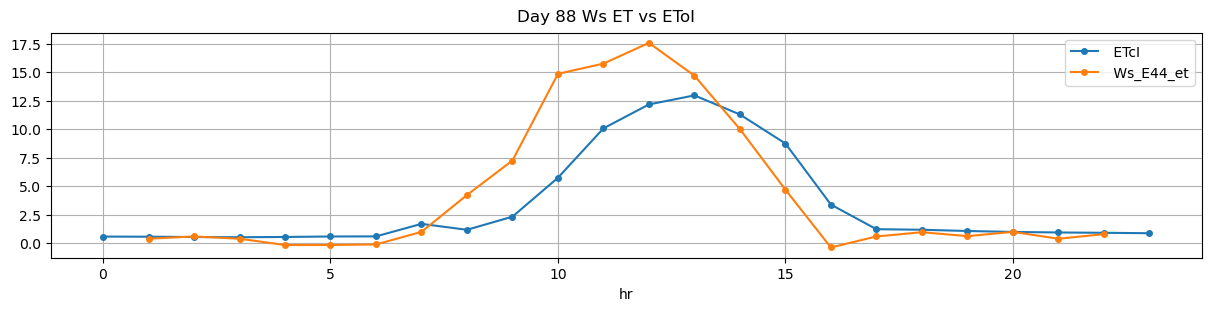
88 |
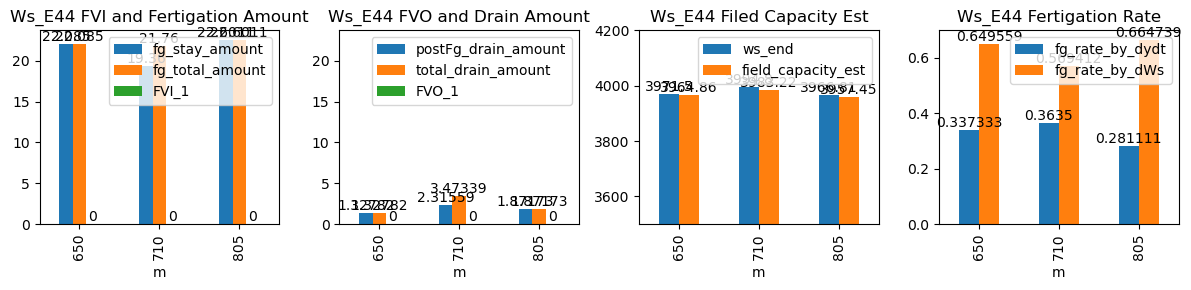
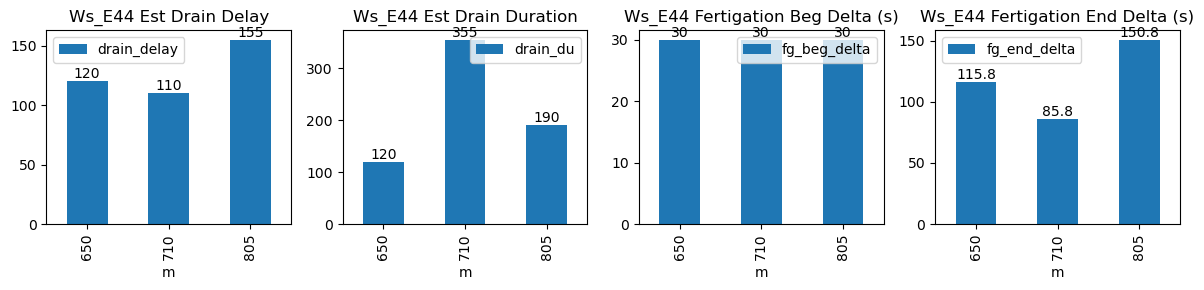
650 |
Ws_E44 |
0.360949 |
30 |
650.0 |
650.5 |
650.57 |
652.500000 |
3861.075 |
3971.500000 |
34 |
-0.108853 |
-0.116611 |
-0.115748 |
0.337333 |
0.649559 |
22.085000 |
True |
30.0 |
115.8 |
22.085000 |
0.000000 |
1.327822 |
1.327822 |
120 |
120 |
-0.055102 |
3964.860892 |
NaN |
NaN |
| 2026-01-02 11:50:00+08:00 |
88 |
710 |
Ws_E44 |
0.360949 |
30 |
710.0 |
710.5 |
710.57 |
712.000000 |
3898.000 |
3994.800000 |
34 |
-0.113280 |
-0.160770 |
-0.123735 |
0.363500 |
0.569412 |
19.360000 |
True |
30.0 |
85.8 |
21.760000 |
1.157795 |
2.315590 |
3.473386 |
355 |
110 |
-0.151581 |
3983.222048 |
NaN |
NaN |
| 2026-01-02 13:25:00+08:00 |
88 |
805 |
Ws_E44 |
0.360949 |
30 |
805.0 |
805.5 |
805.57 |
808.083333 |
3853.800 |
3966.805556 |
34 |
-0.116011 |
-0.102366 |
-0.068688 |
0.281111 |
0.664739 |
22.601111 |
True |
30.0 |
150.8 |
22.601111 |
0.000000 |
1.871733 |
1.871733 |
190 |
155 |
-0.080808 |
3957.446890 |
NaN |
NaN |