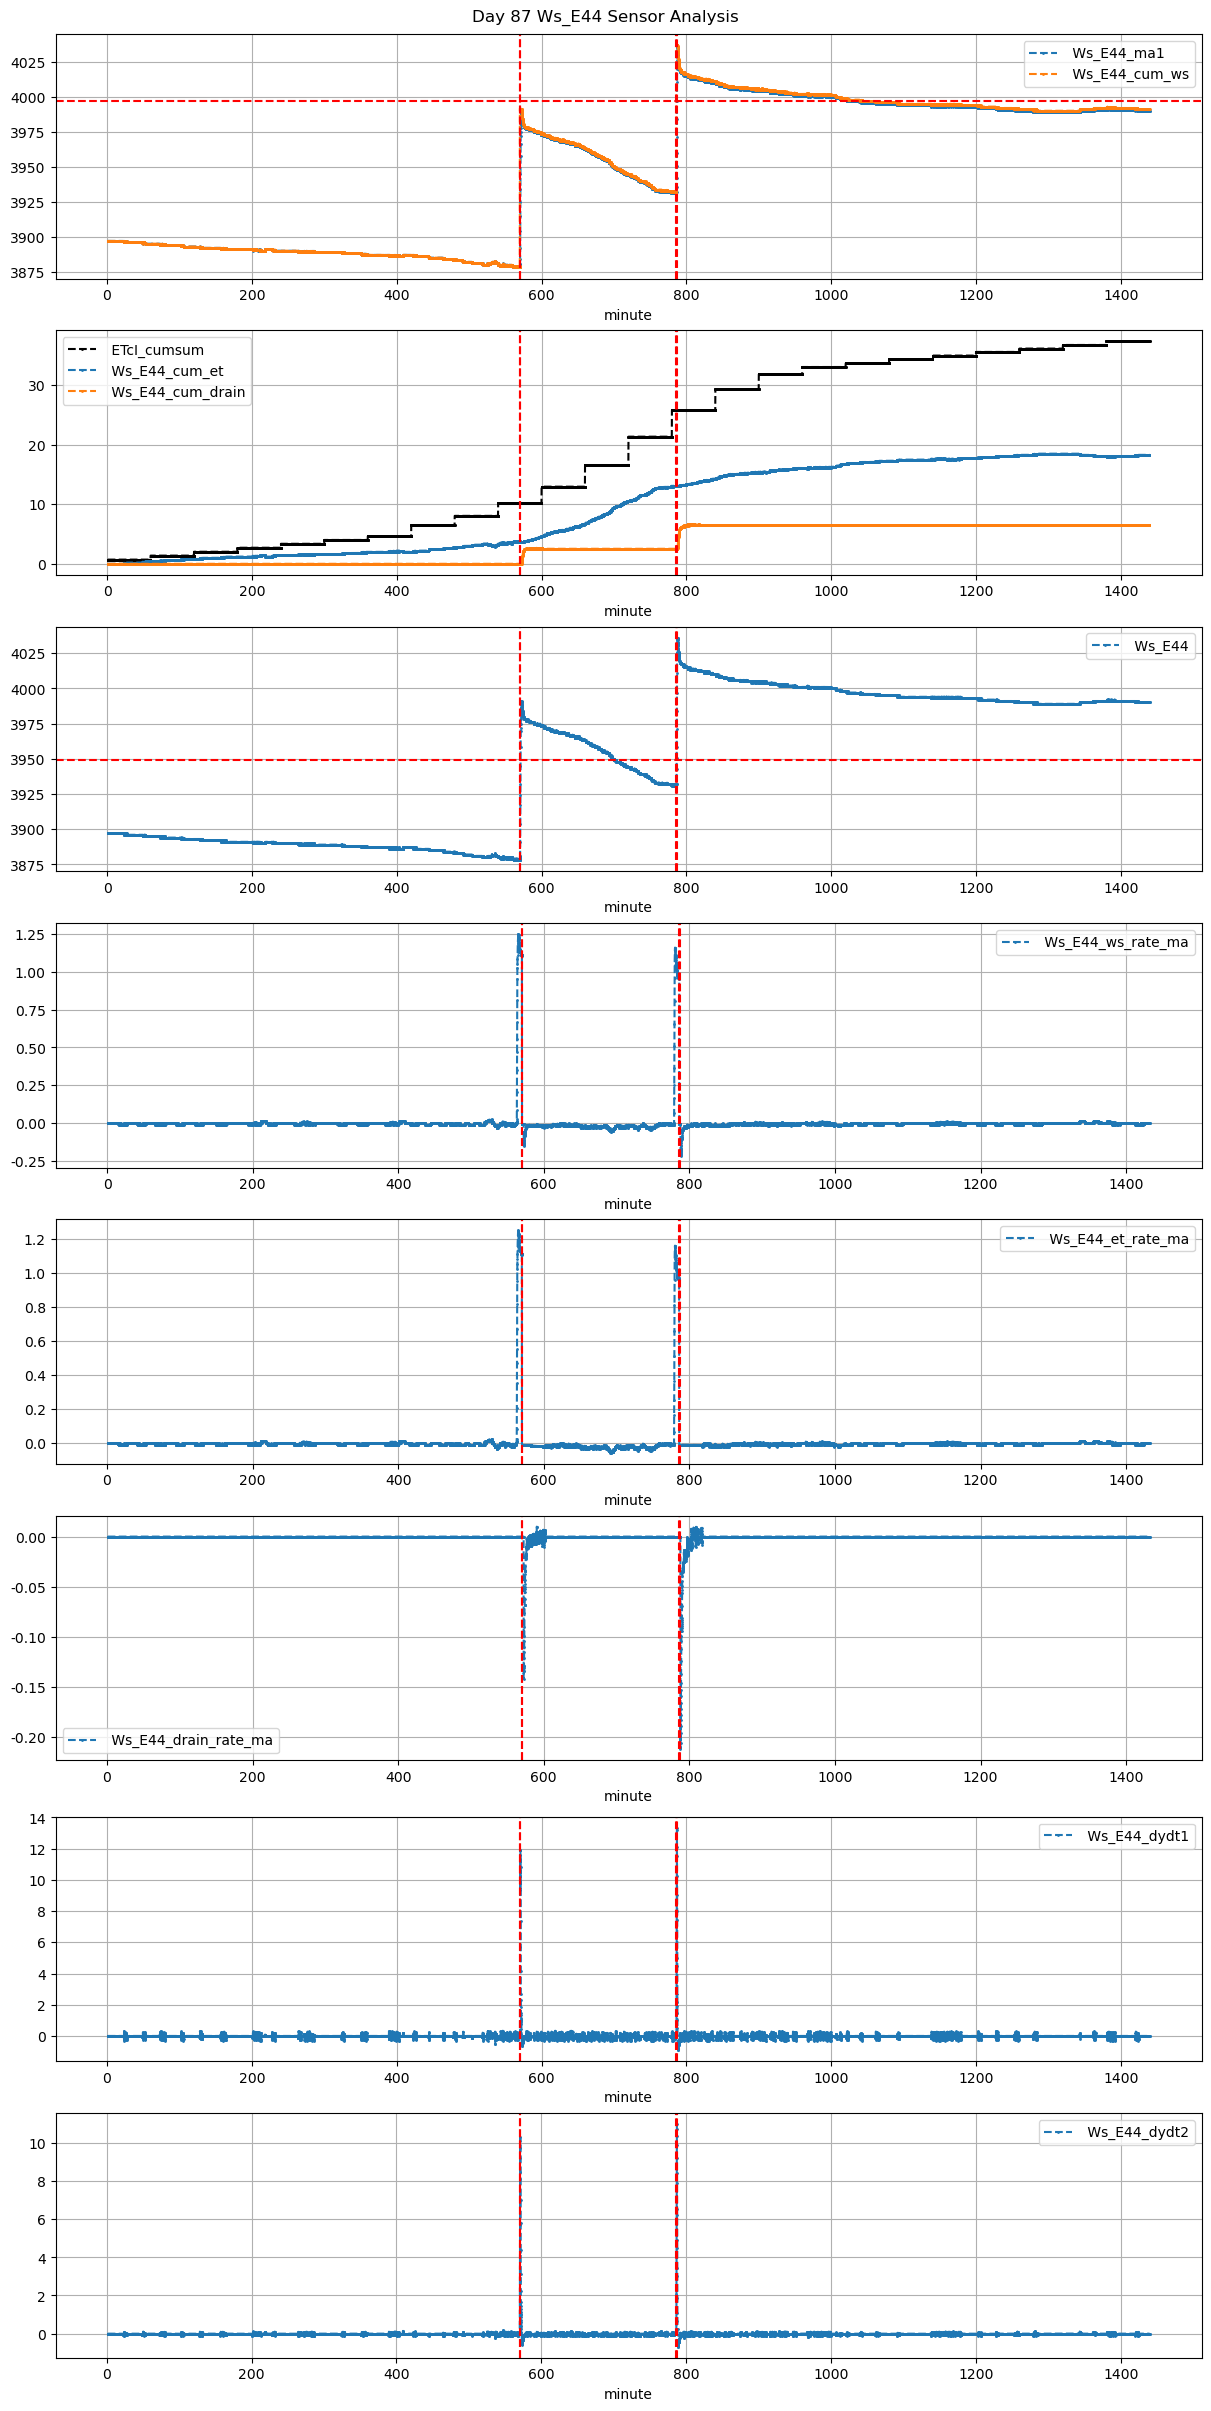
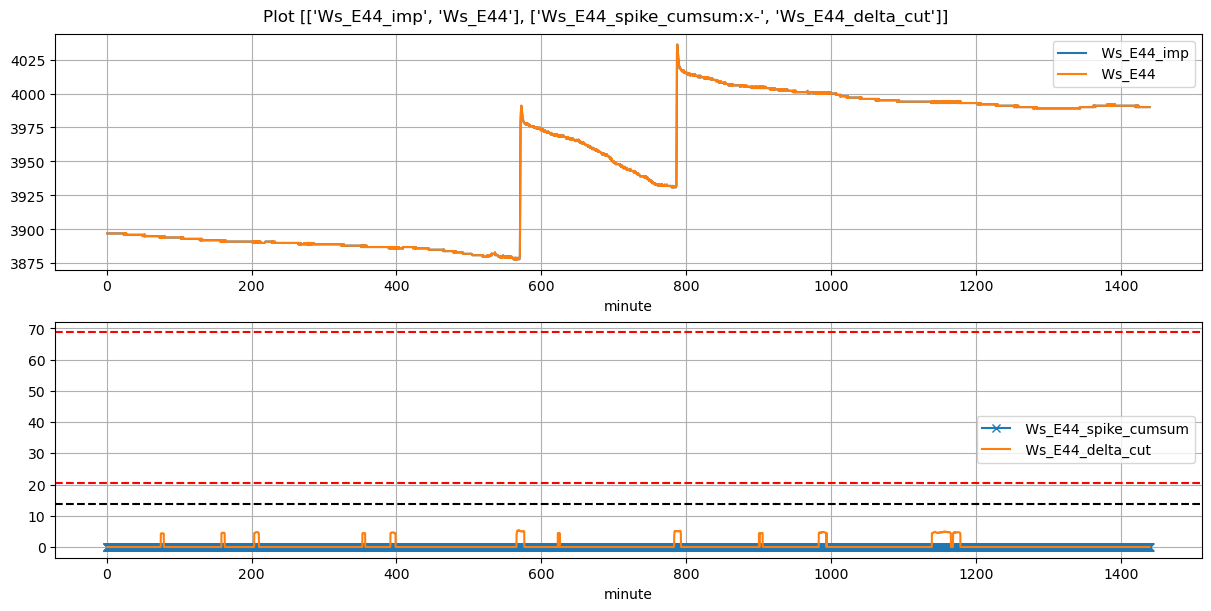
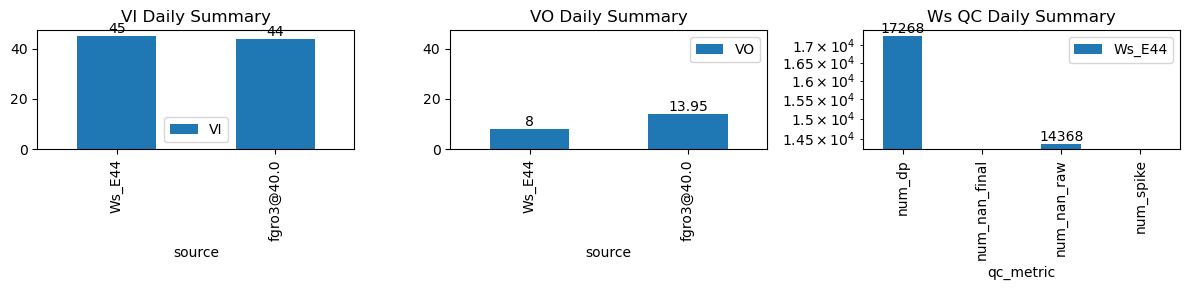
VI and VO Daily Summary
| ws_name | num_dp | num_nan_raw | num_nan_final | num_spike | cum_step_adj |
|---|---|---|---|---|---|
| Ws_E44 | 17,268 | 14,368 | 0 | 0 | 0.00 |
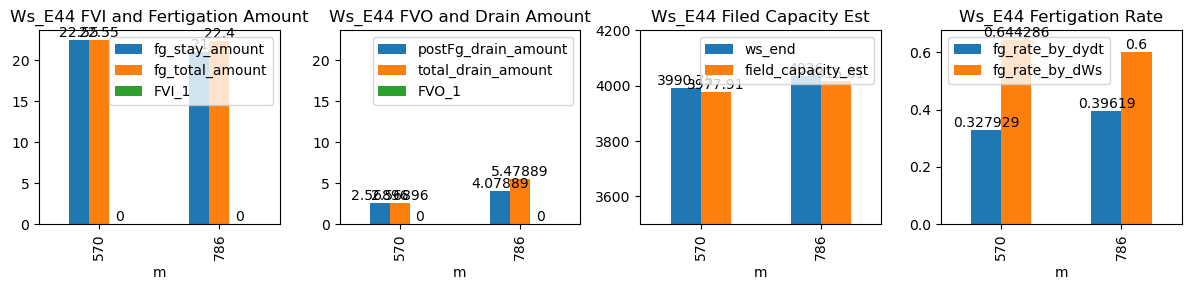
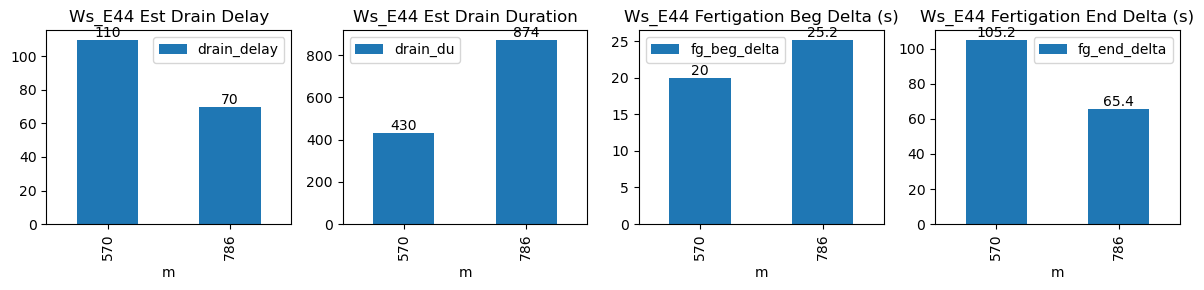
| ds | d | m | ws_name | prominence_cut | max_drain_du | fg_beg | fg_beg_est | fg_end | fg_end_est | ws_beg | ws_end | duc | pre_fg_et | post_fg_ws | post_drn_et | fg_rate_by_dydt | fg_rate_by_dWs | fg_stay_amount | enough_data | fg_beg_delta | fg_end_delta | fg_total_amount | fg_drain_amount | postFg_drain_amount | total_drain_amount | drain_du | drain_delay | drain_rate | field_capacity_est | FVI_1 | FVO_1 |
|---|---|---|---|---|---|---|---|---|---|---|---|---|---|---|---|---|---|---|---|---|---|---|---|---|---|---|---|---|---|---|---|
| 2026-01-01 09:30:00+08:00 | 87 | 570 | Ws_E44 | 0.198757 | 30 | 570.00 | 570.333333 | 570.58 | 572.333333 | 3878.0 | 3990.75 | 35 | -0.009121 | -0.045833 | -0.019591 | 0.327929 | 0.644286 | 22.55 | True | 20.0 | 105.2 | 22.55 | 0.0 | 2.568960 | 2.568960 | 430 | 110 | -0.090918 | 3977.90520 | NaN | NaN |
| 2026-01-01 13:06:05+08:00 | 87 | 786 | Ws_E44 | 0.198757 | 30 | 786.08 | 786.500000 | 786.66 | 787.750000 | 3931.0 | 4036.00 | 35 | -0.008059 | -0.065988 | -0.010453 | 0.396190 | 0.600000 | 21.00 | True | 25.2 | 65.4 | 22.40 | 1.4 | 4.078886 | 5.478886 | 874 | 70 | -0.100744 | 4015.60557 | NaN | NaN |