| 2025-12-31 09:45:00+08:00 |
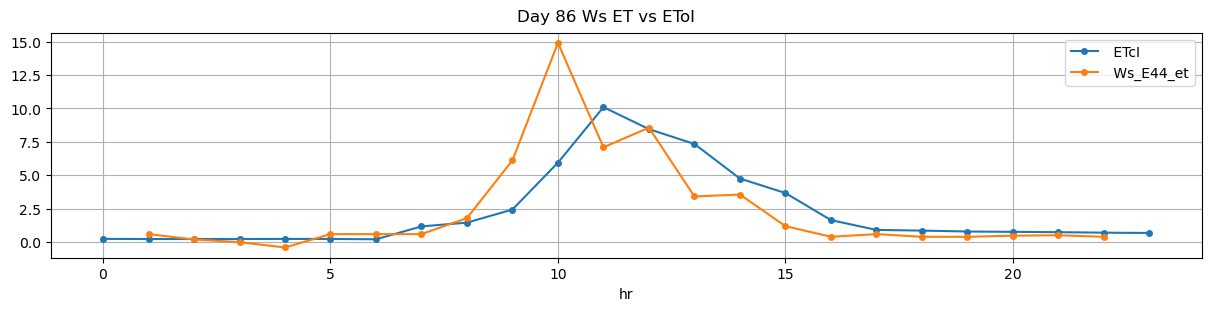
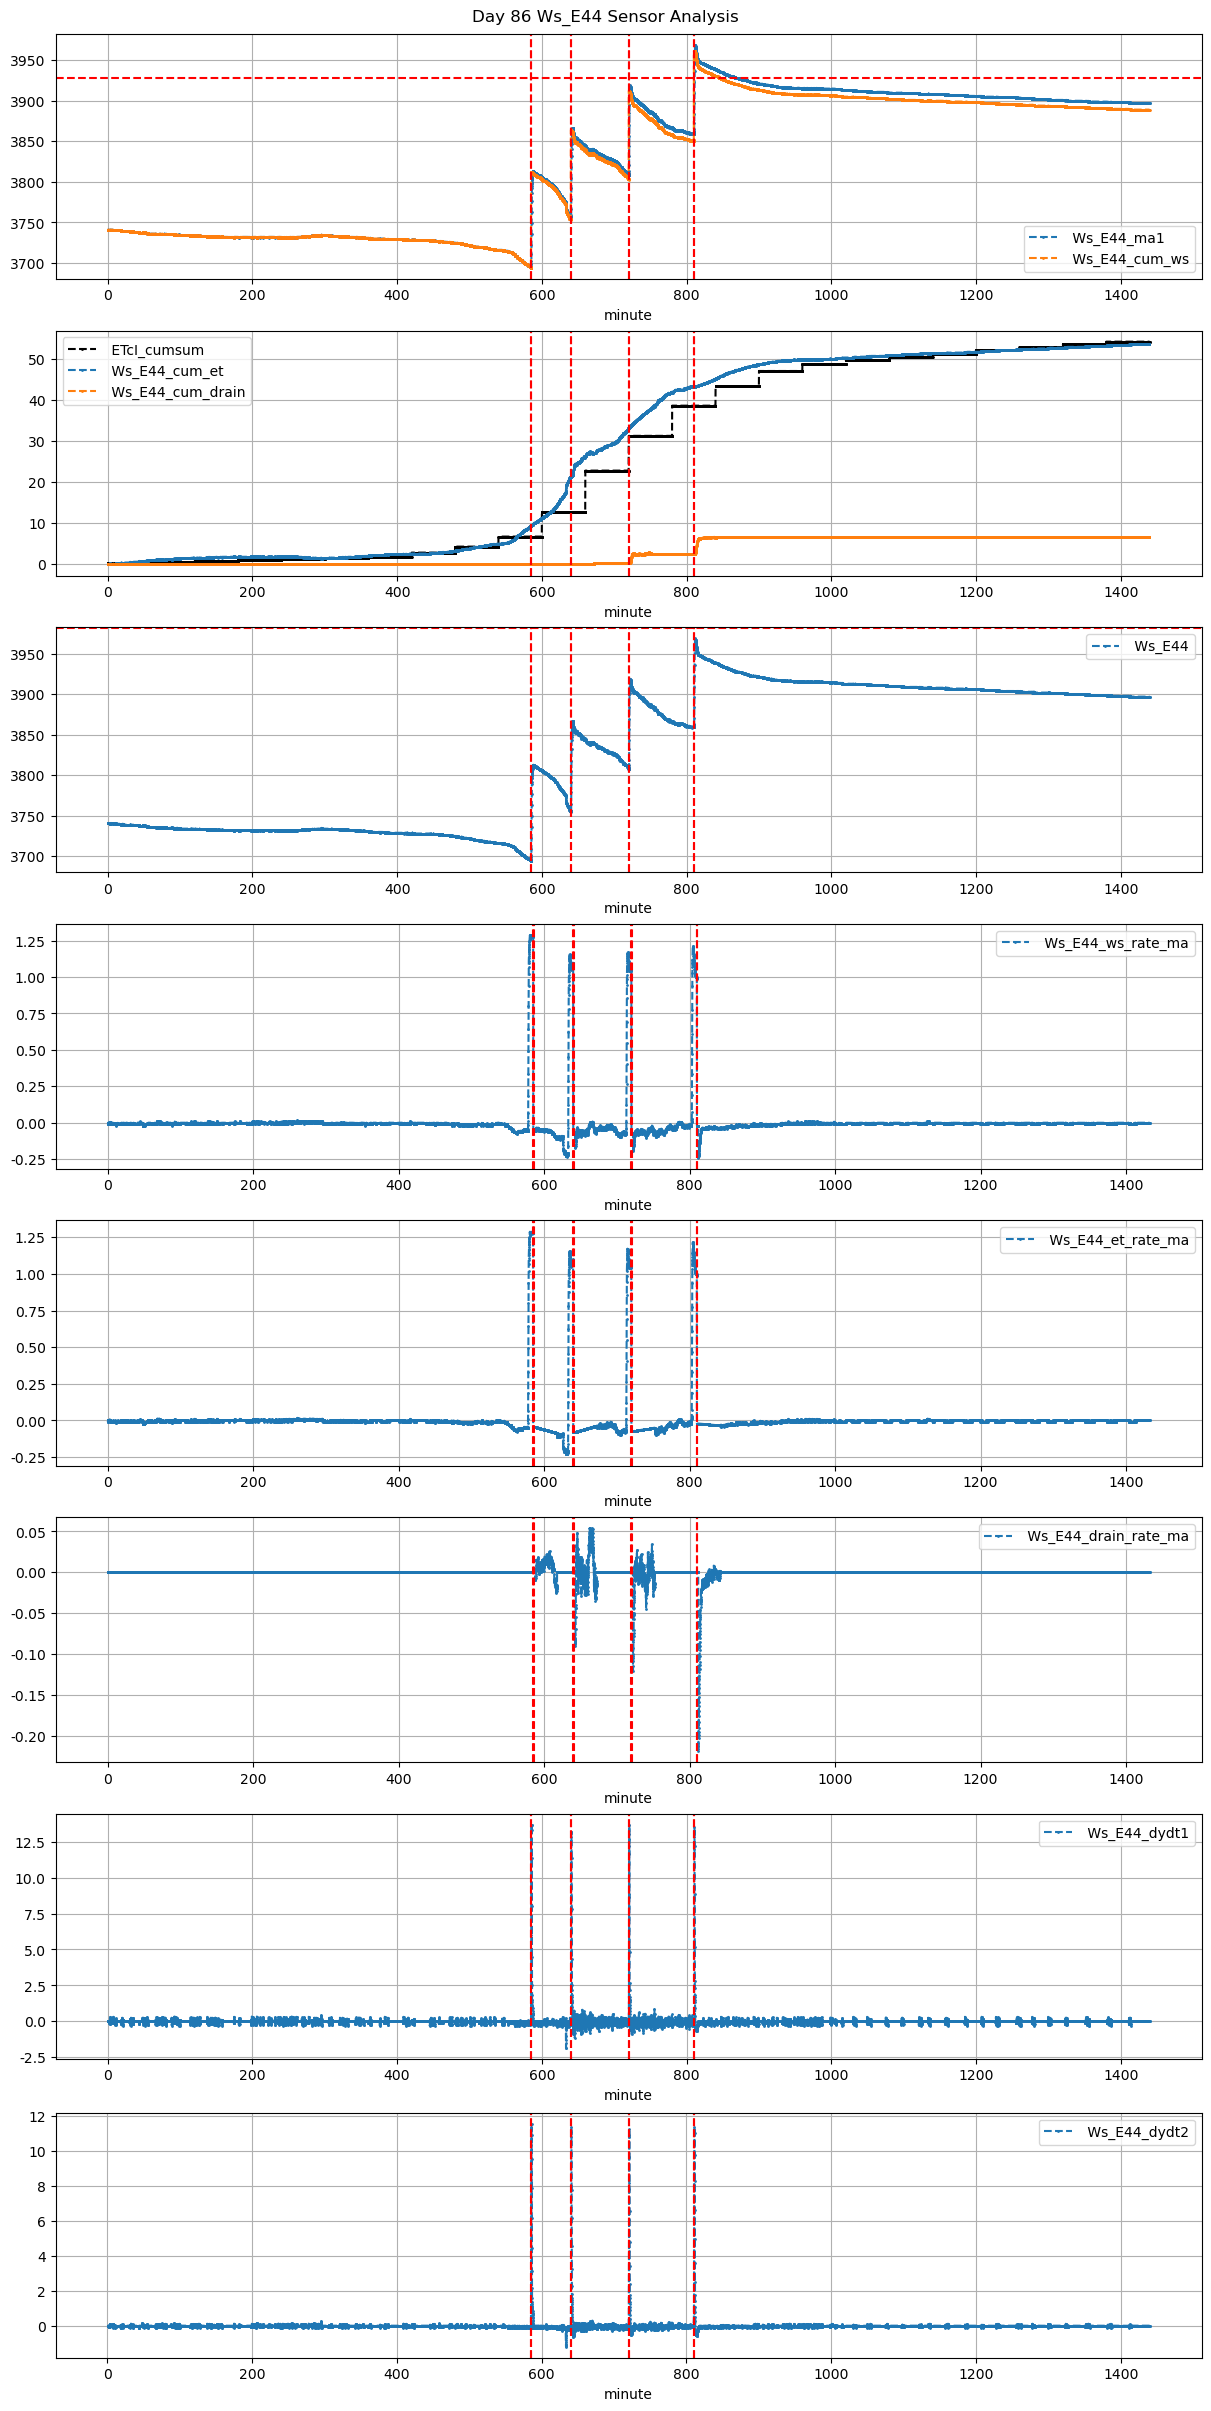
86 |
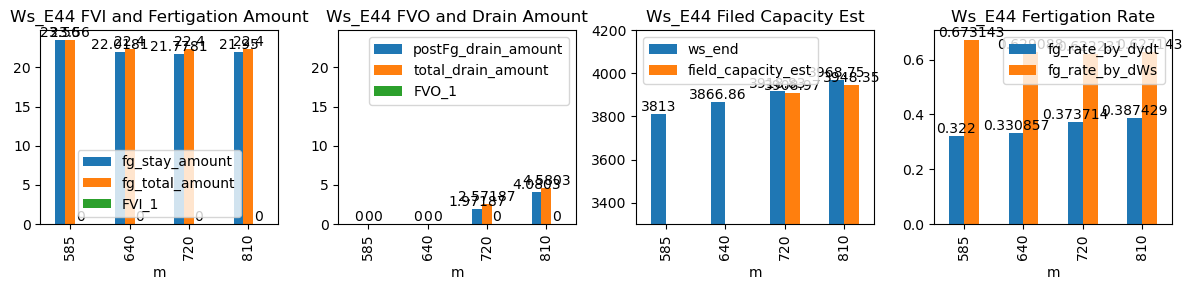
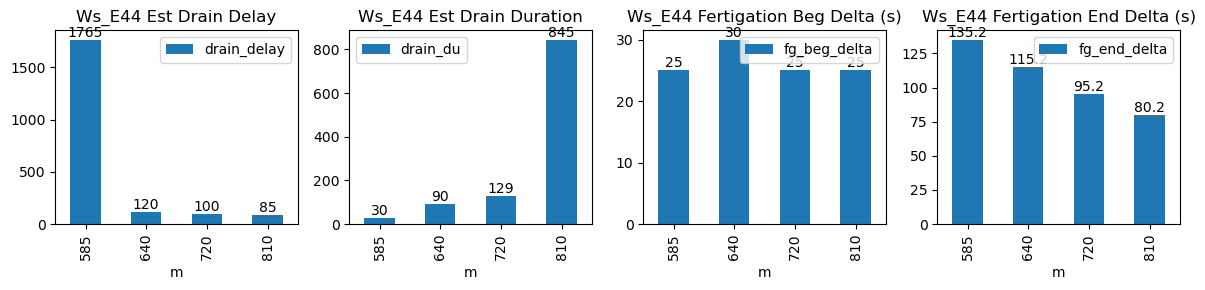
585 |
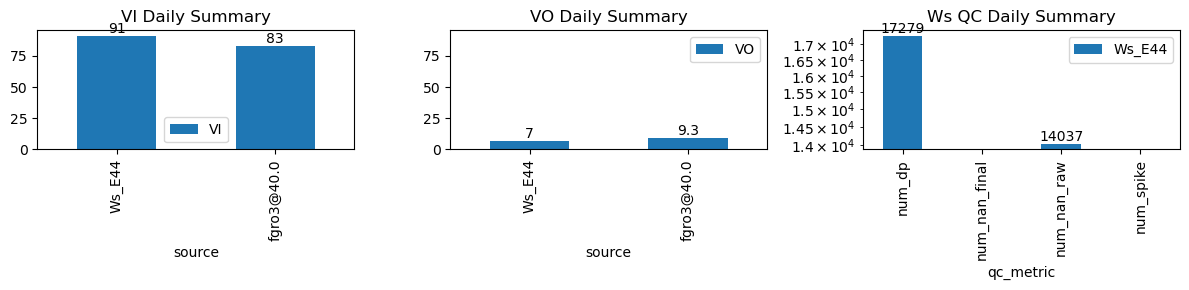
Ws_E44 |
0.29243 |
30 |
585.0 |
585.416667 |
585.58 |
587.833333 |
3695.200000 |
3813.000000 |
35 |
-0.051311 |
-0.046173 |
-0.086672 |
0.322000 |
0.673143 |
23.560000 |
True |
25.0 |
135.2 |
23.56 |
0.0 |
0.000000 |
0.000000 |
30 |
1765 |
-0.014536 |
NaN |
NaN |
NaN |
| 2025-12-31 10:40:00+08:00 |
86 |
640 |
Ws_E44 |
0.29243 |
30 |
640.0 |
640.500000 |
640.58 |
642.500000 |
3756.766667 |
3866.857143 |
35 |
-0.197950 |
-0.080432 |
-0.036615 |
0.330857 |
0.629088 |
22.018095 |
True |
30.0 |
115.2 |
22.40 |
0.0 |
0.000000 |
0.000000 |
90 |
120 |
-0.076061 |
NaN |
NaN |
NaN |
| 2025-12-31 12:00:00+08:00 |
86 |
720 |
Ws_E44 |
0.29243 |
30 |
720.0 |
720.416667 |
720.58 |
722.166667 |
3809.942857 |
3918.833333 |
35 |
-0.074032 |
-0.087006 |
-0.050391 |
0.373714 |
0.622231 |
21.778095 |
True |
25.0 |
95.2 |
22.40 |
0.6 |
1.971870 |
2.571870 |
129 |
100 |
-0.081851 |
3908.973984 |
NaN |
NaN |
| 2025-12-31 13:30:00+08:00 |
86 |
810 |
Ws_E44 |
0.29243 |
30 |
810.0 |
810.416667 |
810.58 |
811.916667 |
3859.000000 |
3968.750000 |
35 |
-0.021650 |
-0.090000 |
-0.035062 |
0.387429 |
0.627143 |
21.950000 |
True |
25.0 |
80.2 |
22.40 |
0.5 |
4.080298 |
4.580298 |
845 |
85 |
-0.143319 |
3948.348510 |
NaN |
NaN |