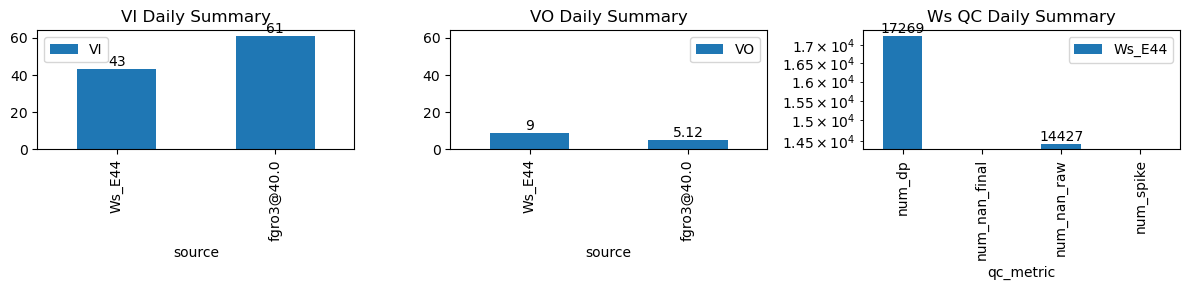
VI and VO Daily Summary
| ws_name | num_dp | num_nan_raw | num_nan_final | num_spike | cum_step_adj |
|---|---|---|---|---|---|
| Ws_E44 | 17,269 | 14,427 | 0 | 0 | 0.00 |
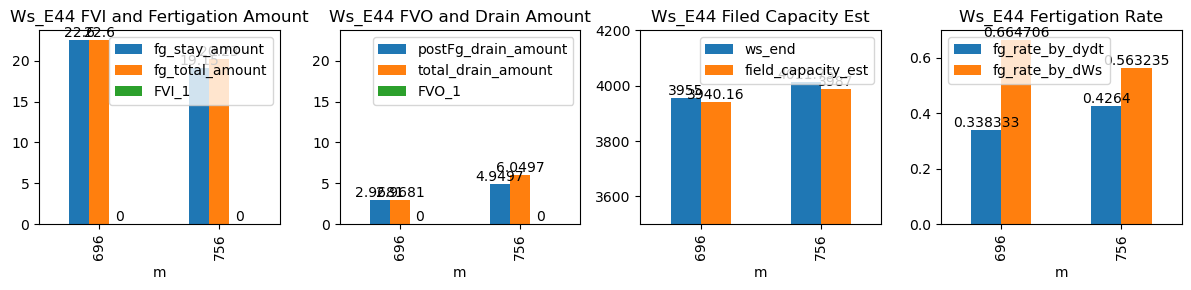
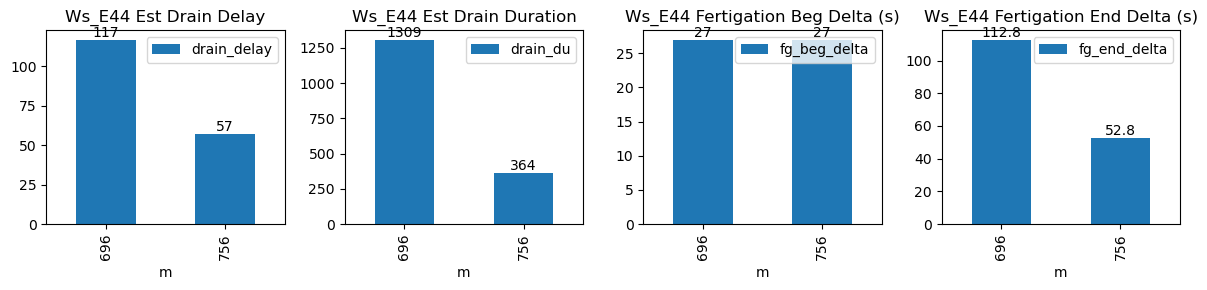
| ds | d | m | ws_name | prominence_cut | max_drain_du | fg_beg | fg_beg_est | fg_end | fg_end_est | ws_beg | ws_end | duc | pre_fg_et | post_fg_ws | post_drn_et | fg_rate_by_dydt | fg_rate_by_dWs | fg_stay_amount | enough_data | fg_beg_delta | fg_end_delta | fg_total_amount | fg_drain_amount | postFg_drain_amount | total_drain_amount | drain_du | drain_delay | drain_rate | field_capacity_est | FVI_1 | FVO_1 |
|---|---|---|---|---|---|---|---|---|---|---|---|---|---|---|---|---|---|---|---|---|---|---|---|---|---|---|---|---|---|---|---|
| 2025-12-21 11:36:03+08:00 | 76 | 696 | Ws_E44 | 0.248492 | 30 | 696.05 | 696.5 | 696.62 | 698.5 | 3842.0 | 3955.00 | 34 | -0.013210 | -0.063961 | -0.035808 | 0.338333 | 0.664706 | 22.60 | True | 27.0 | 112.8 | 22.60 | 0.0 | 2.968102 | 2.968102 | 1309 | 117 | -0.095542 | 3940.159488 | NaN | NaN |
| 2025-12-21 12:36:03+08:00 | 76 | 756 | Ws_E44 | 0.248492 | 30 | 756.05 | 756.5 | 756.62 | 757.5 | 3916.0 | 4011.75 | 34 | -0.055864 | -0.129205 | -0.054903 | 0.426400 | 0.563235 | 19.15 | True | 27.0 | 52.8 | 20.23 | 1.1 | 4.949696 | 6.049696 | 364 | 57 | -0.164814 | 3987.001521 | NaN | NaN |