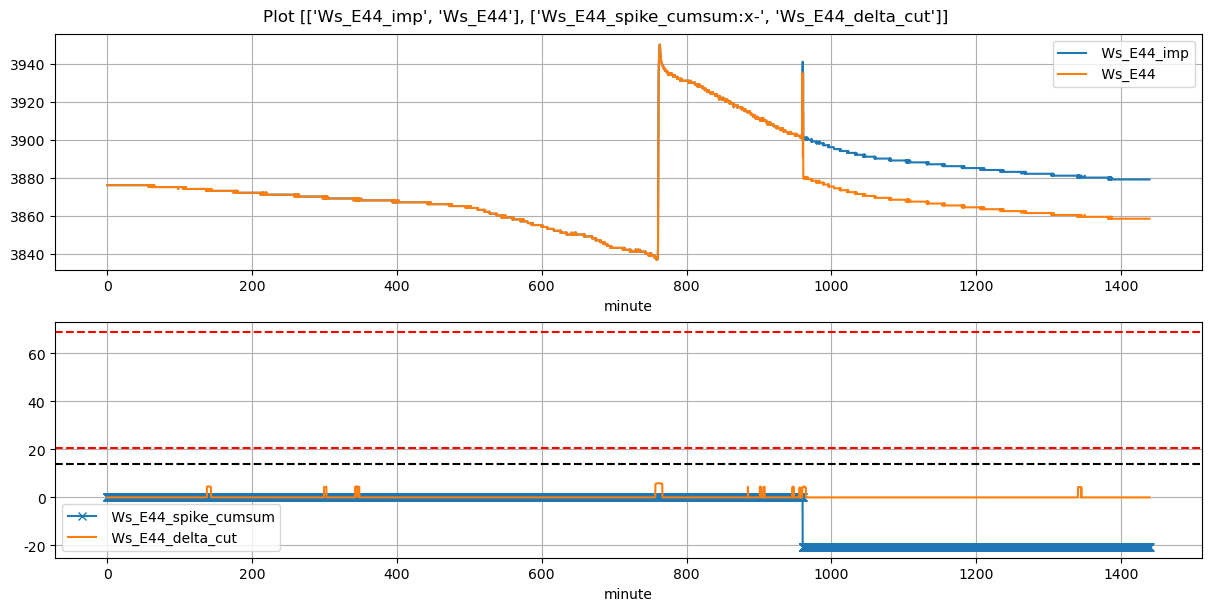
VI and VO Daily Summary
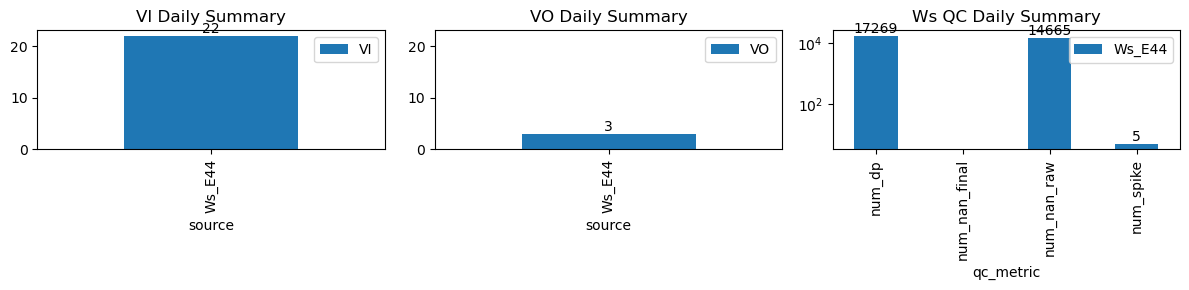
| ws_name | num_dp | num_nan_raw | num_nan_final | num_spike | cum_step_adj |
|---|---|---|---|---|---|
| Ws_E44 | 17,269 | 14,665 | 0 | 5 | -20.67 |
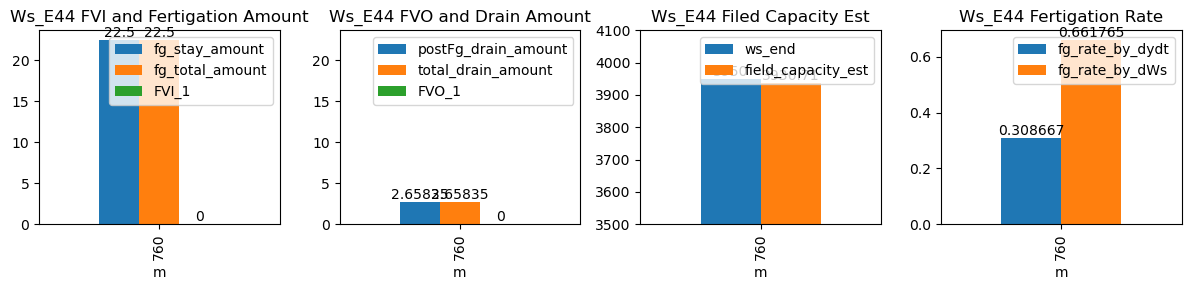
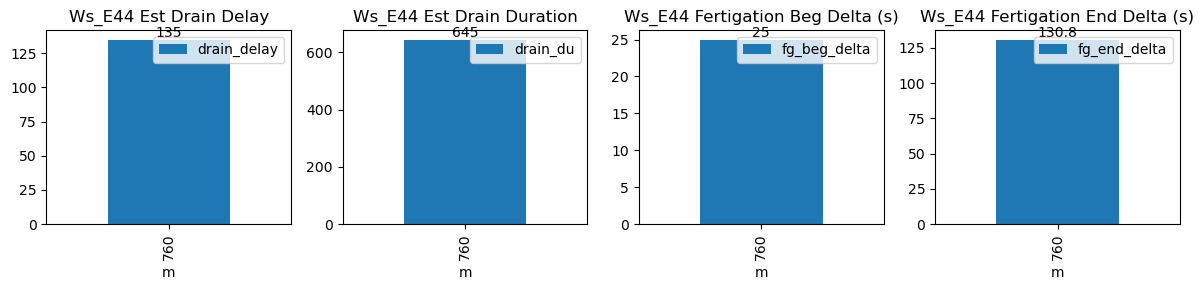
| ds | d | m | ws_name | prominence_cut | max_drain_du | fg_beg | fg_beg_est | fg_end | fg_end_est | ws_beg | ws_end | duc | pre_fg_et | post_fg_ws | post_drn_et | fg_rate_by_dydt | fg_rate_by_dWs | fg_stay_amount | enough_data | fg_beg_delta | fg_end_delta | fg_total_amount | fg_drain_amount | postFg_drain_amount | total_drain_amount | drain_du | drain_delay | drain_rate | field_capacity_est | FVI_1 | FVO_1 |
|---|---|---|---|---|---|---|---|---|---|---|---|---|---|---|---|---|---|---|---|---|---|---|---|---|---|---|---|---|---|---|---|
| 2025-12-20 12:40:00+08:00 | 75 | 760 | Ws_E44 | 0.397457 | 30 | 760.0 | 760.416667 | 760.57 | 762.75 | 3837.5 | 3950.0 | 34 | -0.013483 | -0.061132 | -0.011605 | 0.308667 | 0.661765 | 22.5 | True | 25.0 | 130.8 | 22.5 | 0.0 | 2.658348 | 2.658348 | 645 | 135 | -0.092703 | 3936.70826 | NaN | NaN |