| 2025-12-19 09:46:03+08:00 |
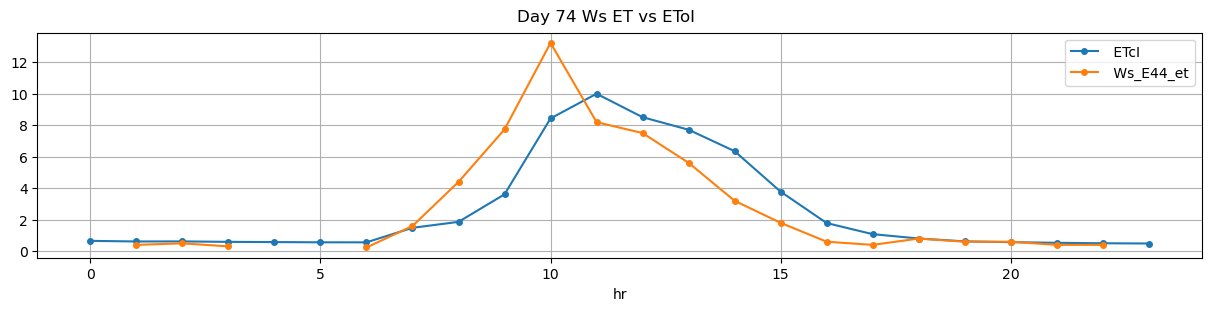
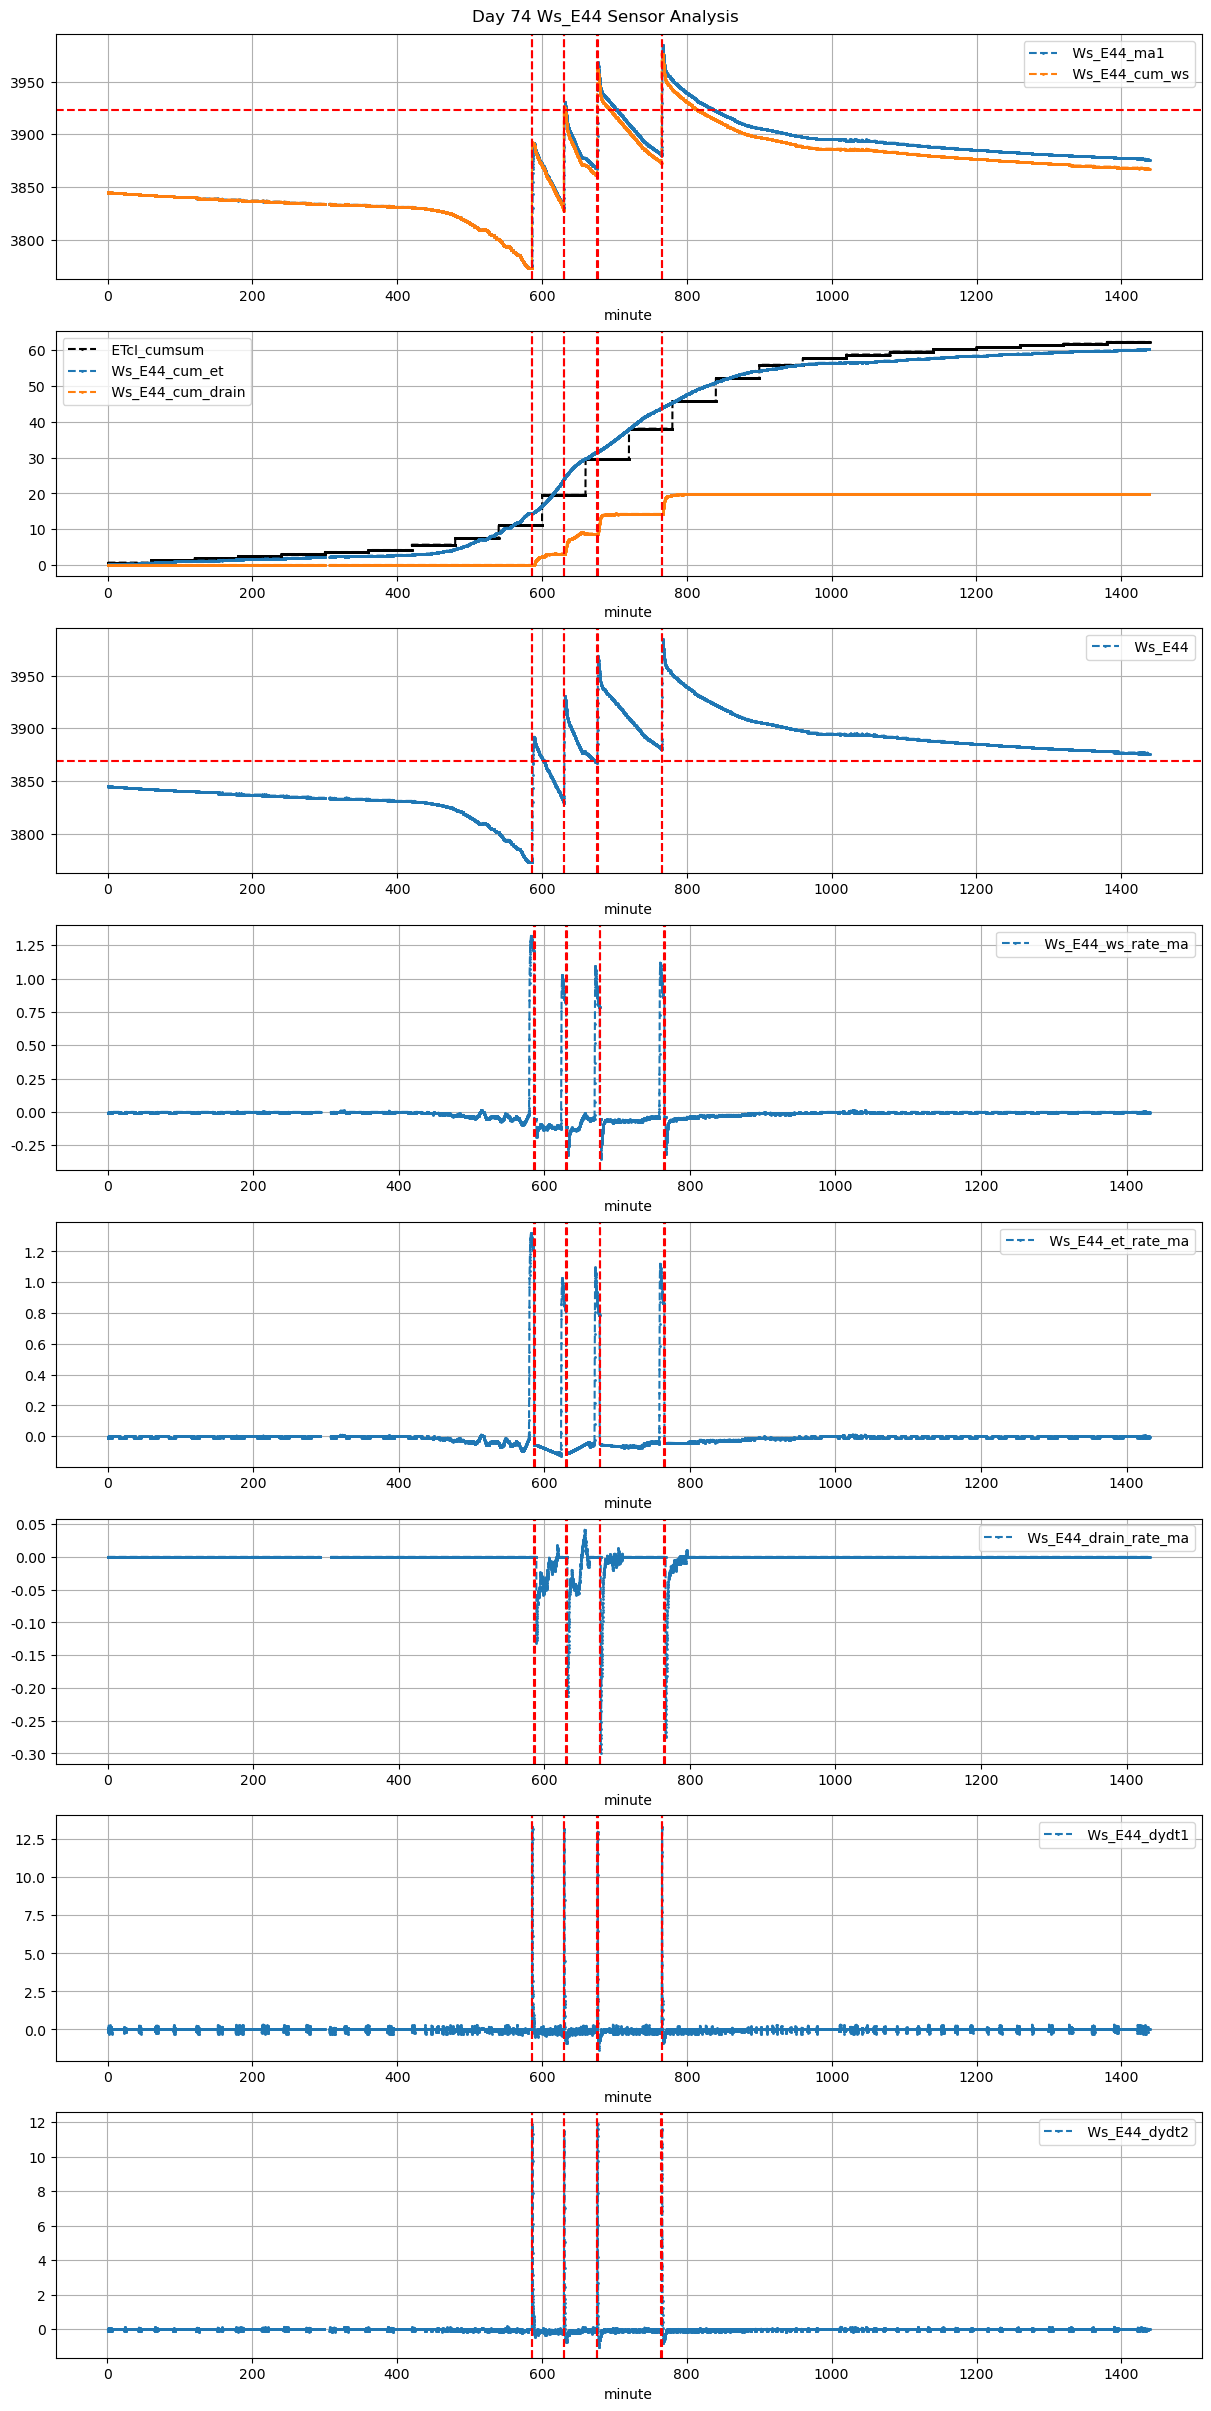
74 |
586 |
Ws_E44 |
0.349636 |
30 |
586.05 |
586.500000 |
586.62 |
589.083333 |
3773.00 |
3891.822222 |
34 |
-0.056481 |
-0.123539 |
-0.114326 |
0.302000 |
0.698954 |
23.764444 |
True |
27.0 |
147.8 |
23.764444 |
0.0 |
3.095568 |
3.095568 |
1645 |
152 |
-0.079874 |
3876.344382 |
NaN |
NaN |
| 2025-12-19 10:30:00+08:00 |
74 |
630 |
Ws_E44 |
0.349636 |
30 |
630.00 |
630.416667 |
630.57 |
631.750000 |
3832.60 |
3930.750000 |
34 |
-0.111933 |
-0.182168 |
-0.036975 |
0.400667 |
0.577353 |
19.630000 |
True |
25.0 |
70.8 |
20.230000 |
0.6 |
5.448196 |
6.048196 |
1140 |
75 |
-0.161615 |
3903.509020 |
NaN |
NaN |
| 2025-12-19 11:16:03+08:00 |
74 |
676 |
Ws_E44 |
0.349636 |
30 |
676.05 |
676.500000 |
676.62 |
677.500000 |
3868.20 |
3968.500000 |
34 |
-0.053277 |
-0.137239 |
-0.067373 |
0.433833 |
0.590000 |
20.060000 |
True |
27.0 |
52.8 |
20.230000 |
0.2 |
5.314502 |
5.514502 |
529 |
57 |
-0.171081 |
3941.927489 |
NaN |
NaN |
| 2025-12-19 12:45:00+08:00 |
74 |
765 |
Ws_E44 |
0.349636 |
30 |
765.00 |
765.416667 |
765.57 |
766.666667 |
3881.15 |
3984.666667 |
34 |
-0.041968 |
-0.128148 |
-0.046605 |
0.421667 |
0.608922 |
20.703333 |
True |
25.0 |
65.8 |
20.703333 |
0.0 |
5.426430 |
5.426430 |
1074 |
70 |
-0.177460 |
3957.534516 |
NaN |
NaN |