| 2025-12-09 08:30:00+08:00 |
64 |
510 |
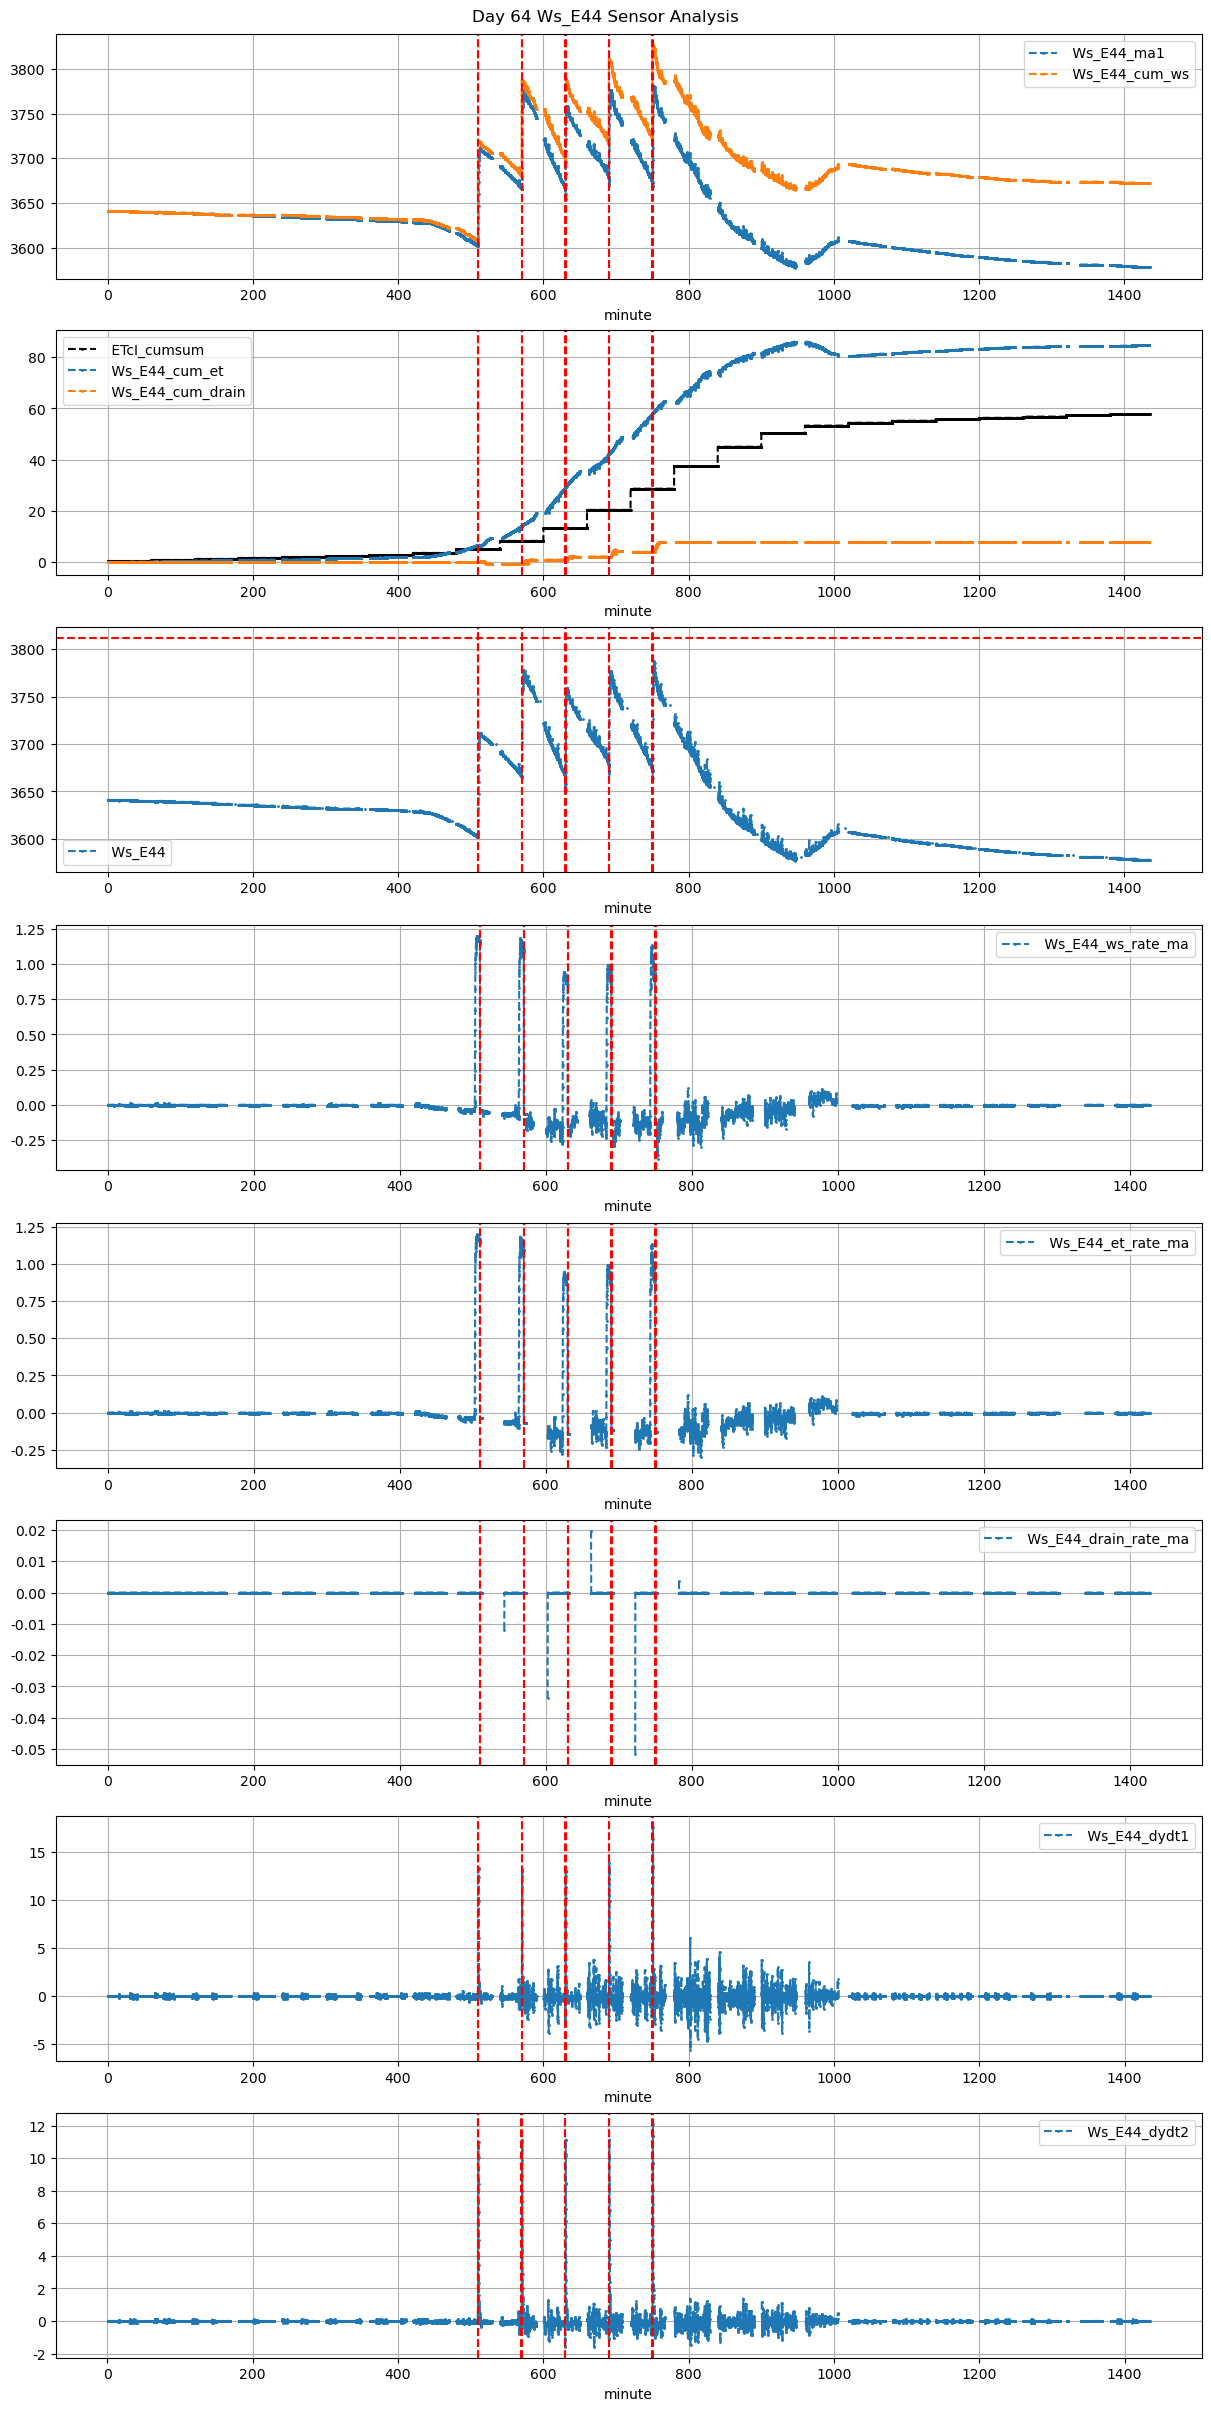
Ws_E44 |
0.738498 |
30 |
510.0 |
510.333333 |
510.58 |
513.416667 |
3603.000000 |
3711.909091 |
35 |
-0.040200 |
-0.051150 |
-0.058973 |
0.241143 |
0.622338 |
21.781818 |
True |
20.0 |
170.2 |
21.781818 |
0.0 |
0 |
0.0 |
NaN |
NaN |
NaN |
NaN |
NaN |
NaN |
| 2025-12-09 09:30:00+08:00 |
64 |
570 |
Ws_E44 |
0.738498 |
30 |
570.0 |
570.500000 |
570.58 |
572.833333 |
3668.780952 |
3776.000000 |
35 |
-0.068040 |
-0.119028 |
-0.146804 |
0.304762 |
0.612680 |
21.443810 |
True |
30.0 |
135.2 |
21.443810 |
0.0 |
0 |
0.0 |
NaN |
NaN |
NaN |
NaN |
NaN |
NaN |
| 2025-12-09 10:30:00+08:00 |
64 |
630 |
Ws_E44 |
0.738498 |
30 |
630.0 |
630.500000 |
630.58 |
632.333333 |
3669.000000 |
3759.000000 |
35 |
-0.152674 |
-0.147981 |
-0.101142 |
0.338971 |
0.514286 |
18.000000 |
True |
30.0 |
105.2 |
20.335000 |
0.0 |
0 |
0.0 |
NaN |
NaN |
NaN |
NaN |
NaN |
NaN |
| 2025-12-09 11:30:00+08:00 |
64 |
690 |
Ws_E44 |
0.738498 |
30 |
690.0 |
690.500000 |
690.58 |
692.750000 |
3682.000000 |
3776.750000 |
35 |
-0.118372 |
-0.180772 |
-0.118580 |
0.309714 |
0.541429 |
18.950000 |
True |
30.0 |
130.2 |
20.335000 |
0.0 |
0 |
0.0 |
NaN |
NaN |
NaN |
NaN |
NaN |
NaN |
| 2025-12-09 12:30:00+08:00 |
64 |
750 |
Ws_E44 |
0.738498 |
30 |
750.0 |
750.500000 |
750.58 |
752.750000 |
3676.520000 |
3780.666667 |
35 |
-0.133070 |
-0.169875 |
-0.131368 |
0.308571 |
0.595124 |
20.829333 |
True |
30.0 |
130.2 |
20.829333 |
0.0 |
0 |
0.0 |
NaN |
NaN |
NaN |
NaN |
NaN |
NaN |