| 2025-12-08 08:05:00+08:00 |
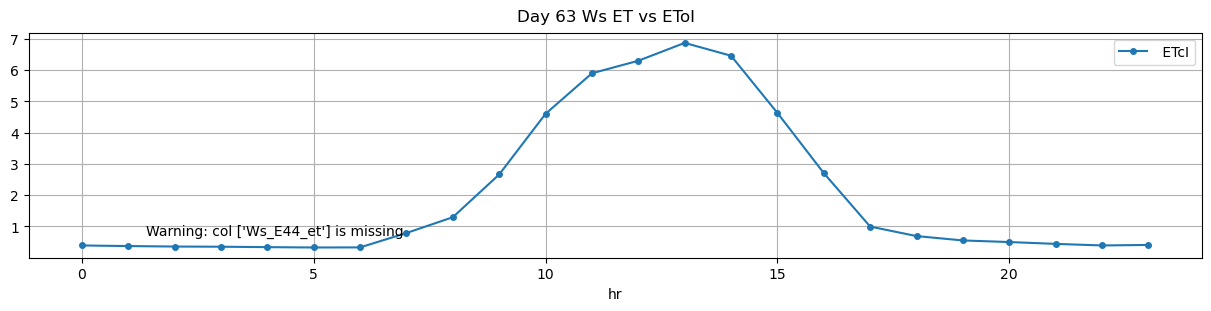
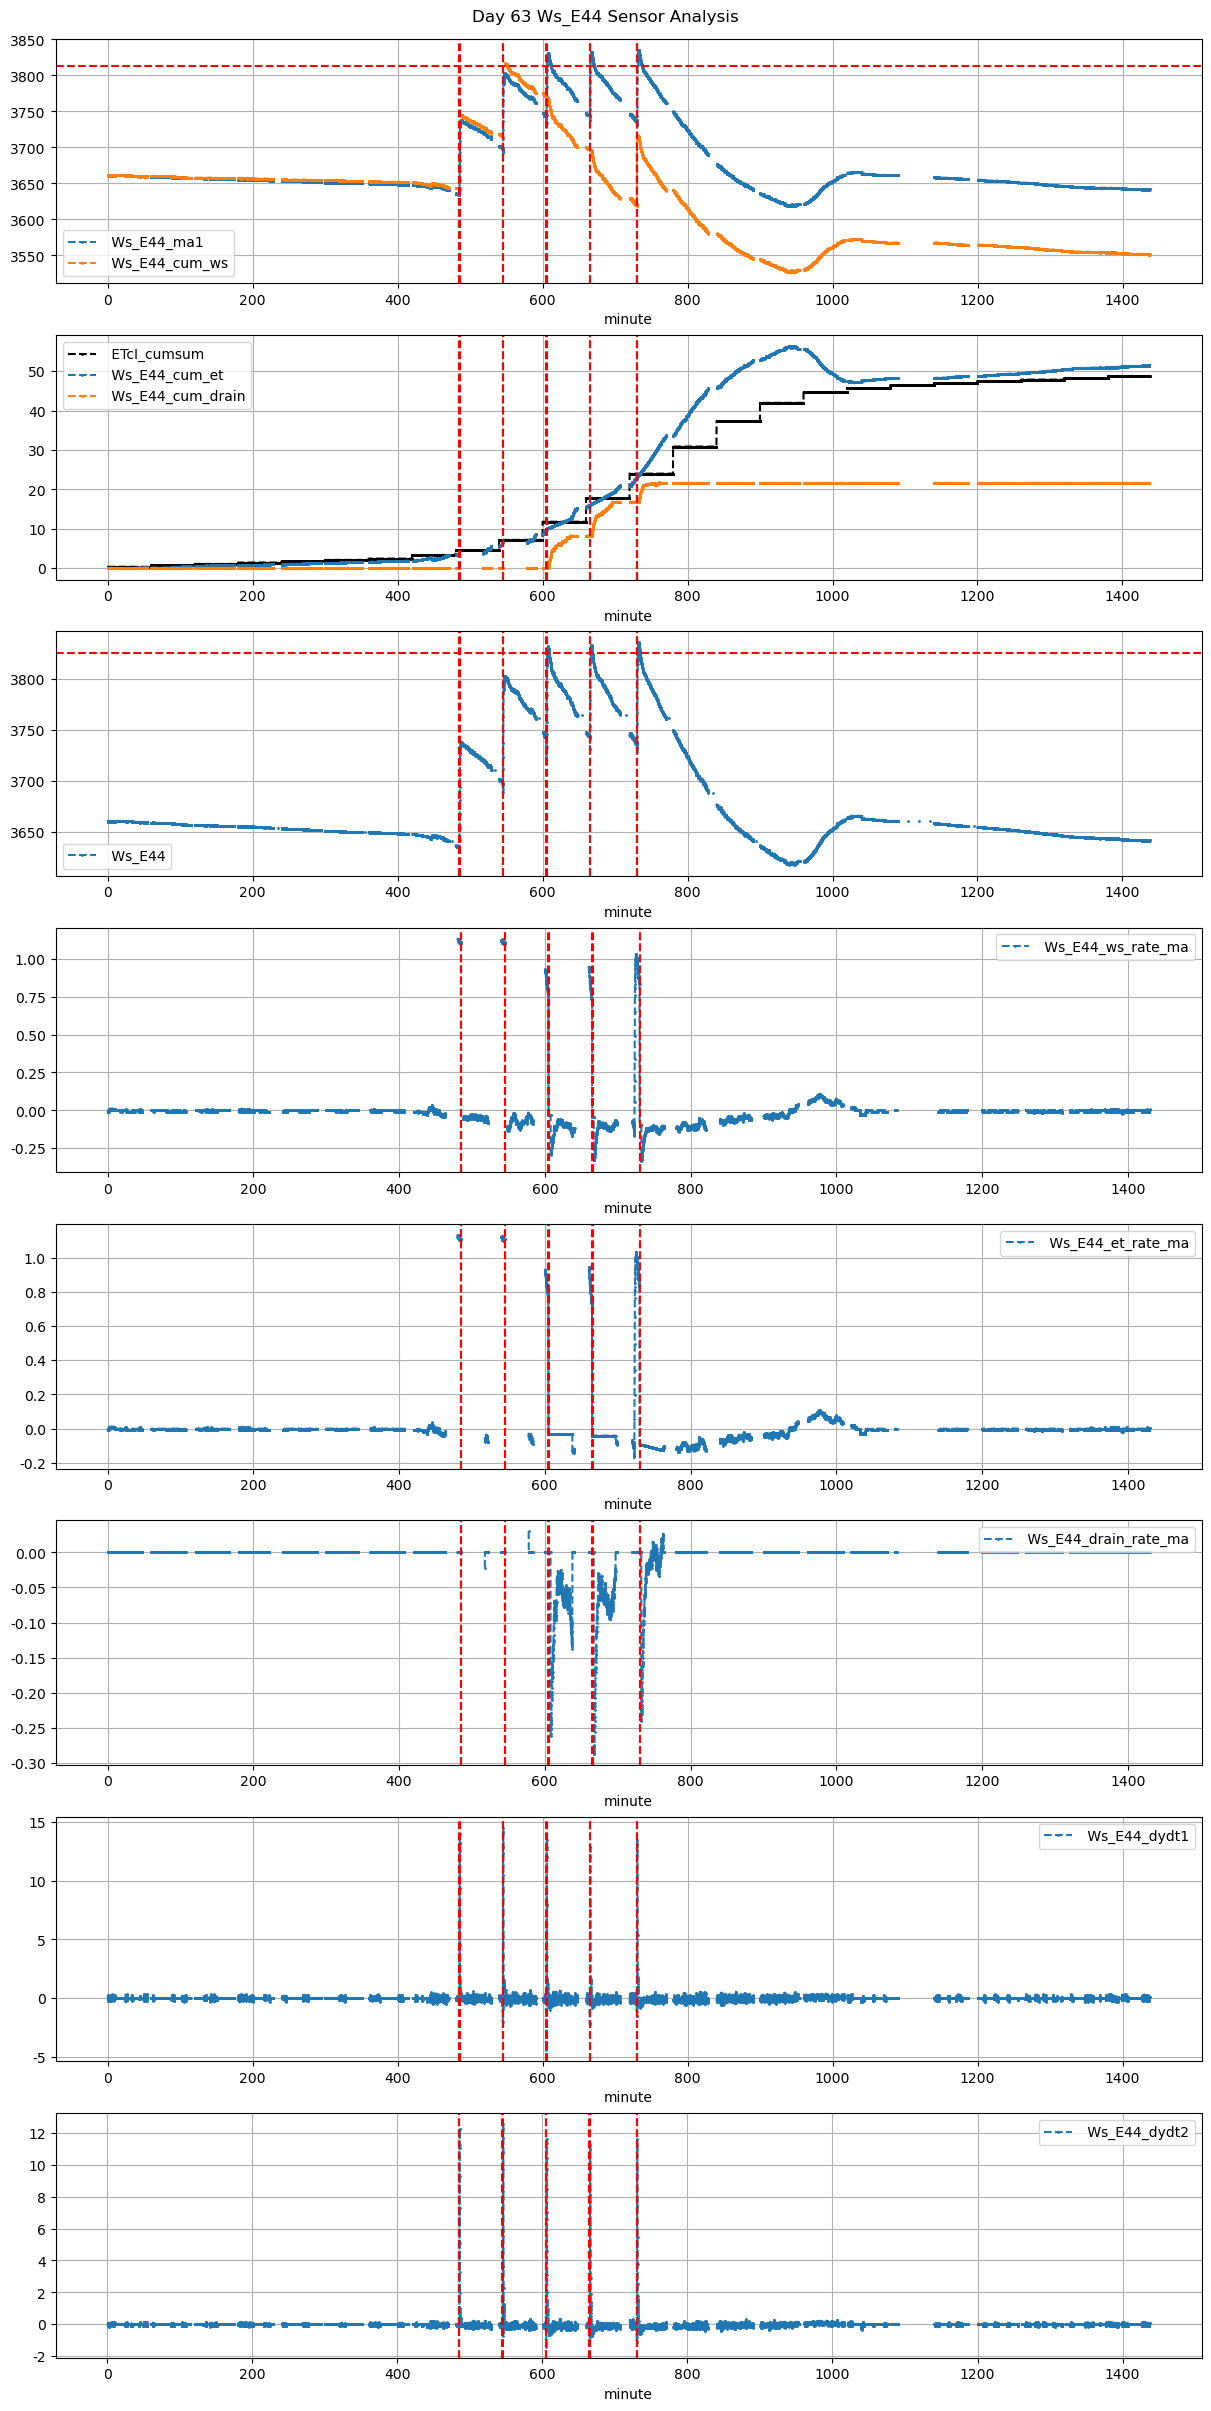
63 |
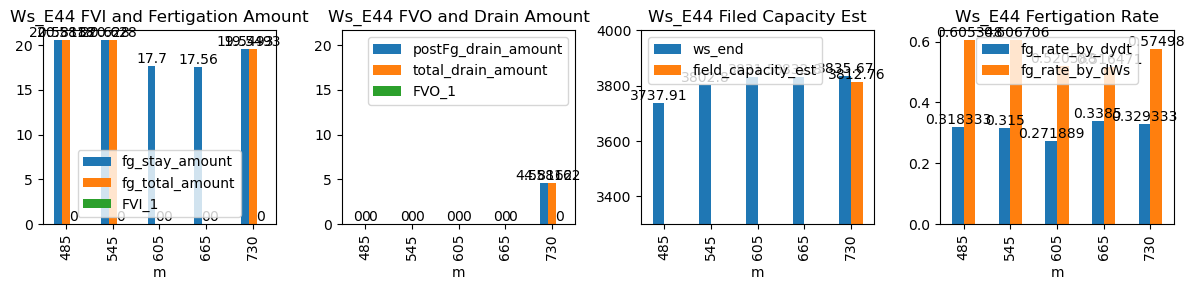
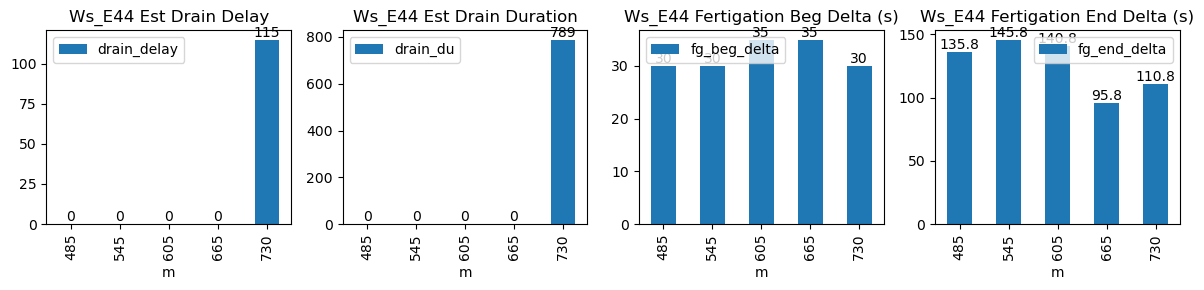
485 |
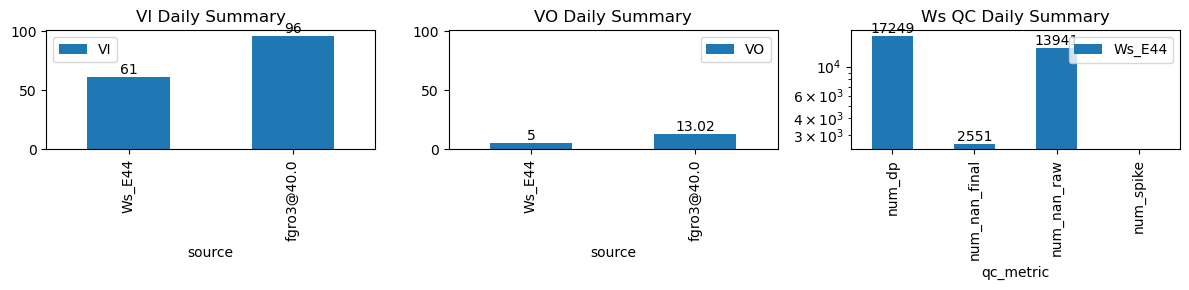
Ws_E44 |
0.438691 |
30 |
485.0 |
485.500000 |
485.57 |
487.833333 |
3635.00 |
3737.909091 |
34 |
NaN |
-0.048943 |
-0.054618 |
0.318333 |
0.605348 |
20.581818 |
True |
30.0 |
135.8 |
20.581818 |
0.0 |
0.000000 |
0.000000 |
NaN |
NaN |
NaN |
NaN |
NaN |
NaN |
| 2025-12-08 09:05:00+08:00 |
63 |
545 |
Ws_E44 |
0.438691 |
30 |
545.0 |
545.500000 |
545.57 |
548.000000 |
3699.66 |
3802.800000 |
34 |
NaN |
-0.095556 |
-0.058369 |
0.315000 |
0.606706 |
20.628000 |
True |
30.0 |
145.8 |
20.628000 |
0.0 |
0.000000 |
0.000000 |
NaN |
NaN |
NaN |
NaN |
NaN |
NaN |
| 2025-12-08 10:05:00+08:00 |
63 |
605 |
Ws_E44 |
0.438691 |
30 |
605.0 |
605.583333 |
605.57 |
607.916667 |
3743.00 |
3831.500000 |
34 |
-0.031972 |
-0.175889 |
-0.031972 |
0.271889 |
0.520588 |
17.700000 |
False |
35.0 |
140.8 |
NaN |
NaN |
NaN |
NaN |
NaN |
NaN |
NaN |
NaN |
NaN |
NaN |
| 2025-12-08 11:05:00+08:00 |
63 |
665 |
Ws_E44 |
0.438691 |
30 |
665.0 |
665.583333 |
665.57 |
667.166667 |
3745.00 |
3832.800000 |
34 |
-0.040966 |
-0.176975 |
-0.040966 |
0.338500 |
0.516471 |
17.560000 |
False |
35.0 |
95.8 |
NaN |
NaN |
NaN |
NaN |
NaN |
NaN |
NaN |
NaN |
NaN |
NaN |
| 2025-12-08 12:10:00+08:00 |
63 |
730 |
Ws_E44 |
0.438691 |
30 |
730.0 |
730.500000 |
730.57 |
732.416667 |
3737.92 |
3835.666667 |
34 |
-0.093889 |
-0.202037 |
-0.126728 |
0.329333 |
0.574980 |
19.549333 |
True |
30.0 |
110.8 |
19.549333 |
0.0 |
4.581621 |
4.581621 |
789.0 |
115.0 |
-0.189138 |
3812.758561 |
NaN |
NaN |