| 2025-12-07 08:05:00+08:00 |
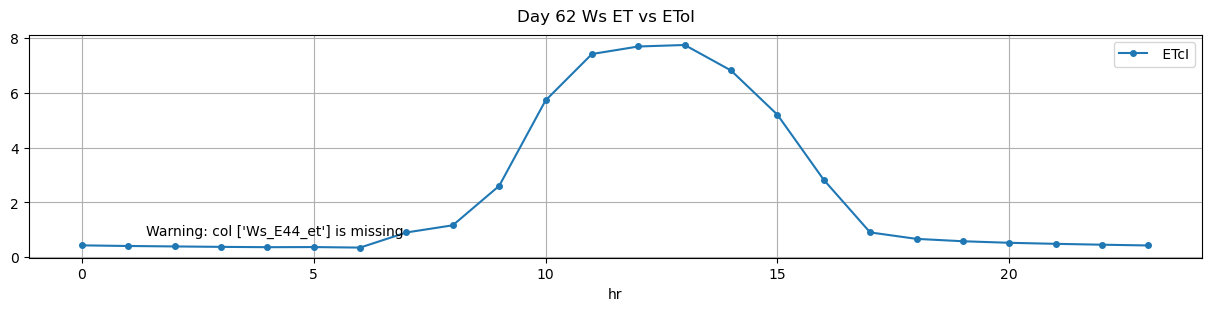
62 |
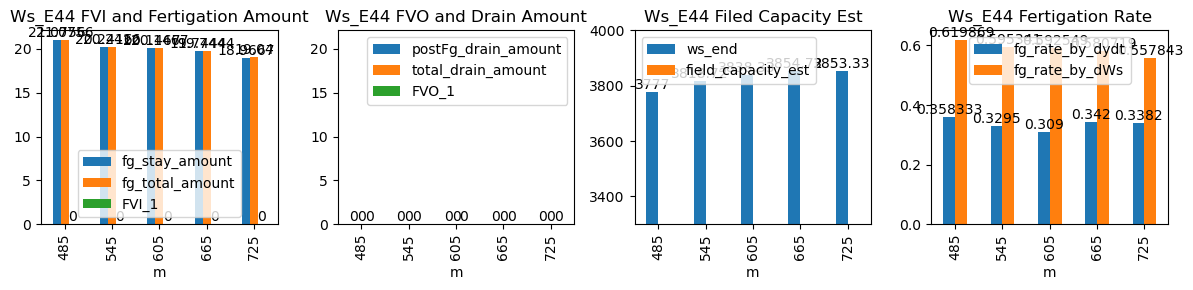
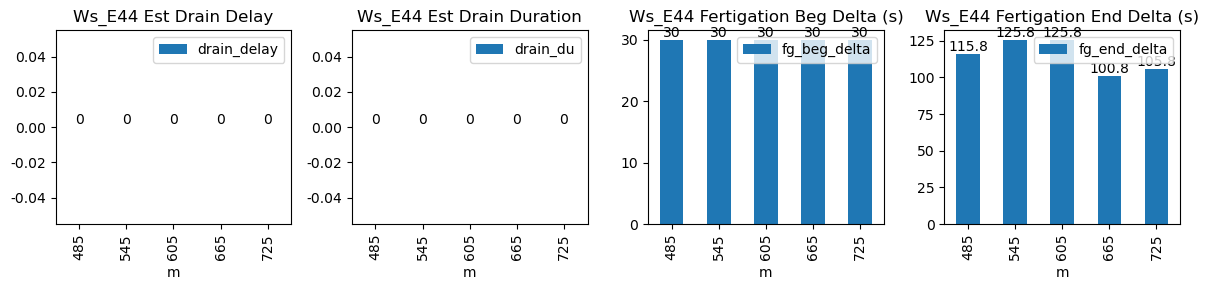
485 |
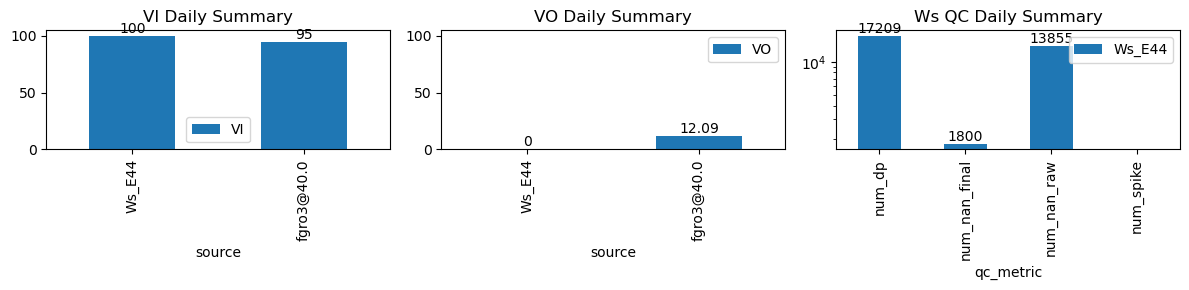
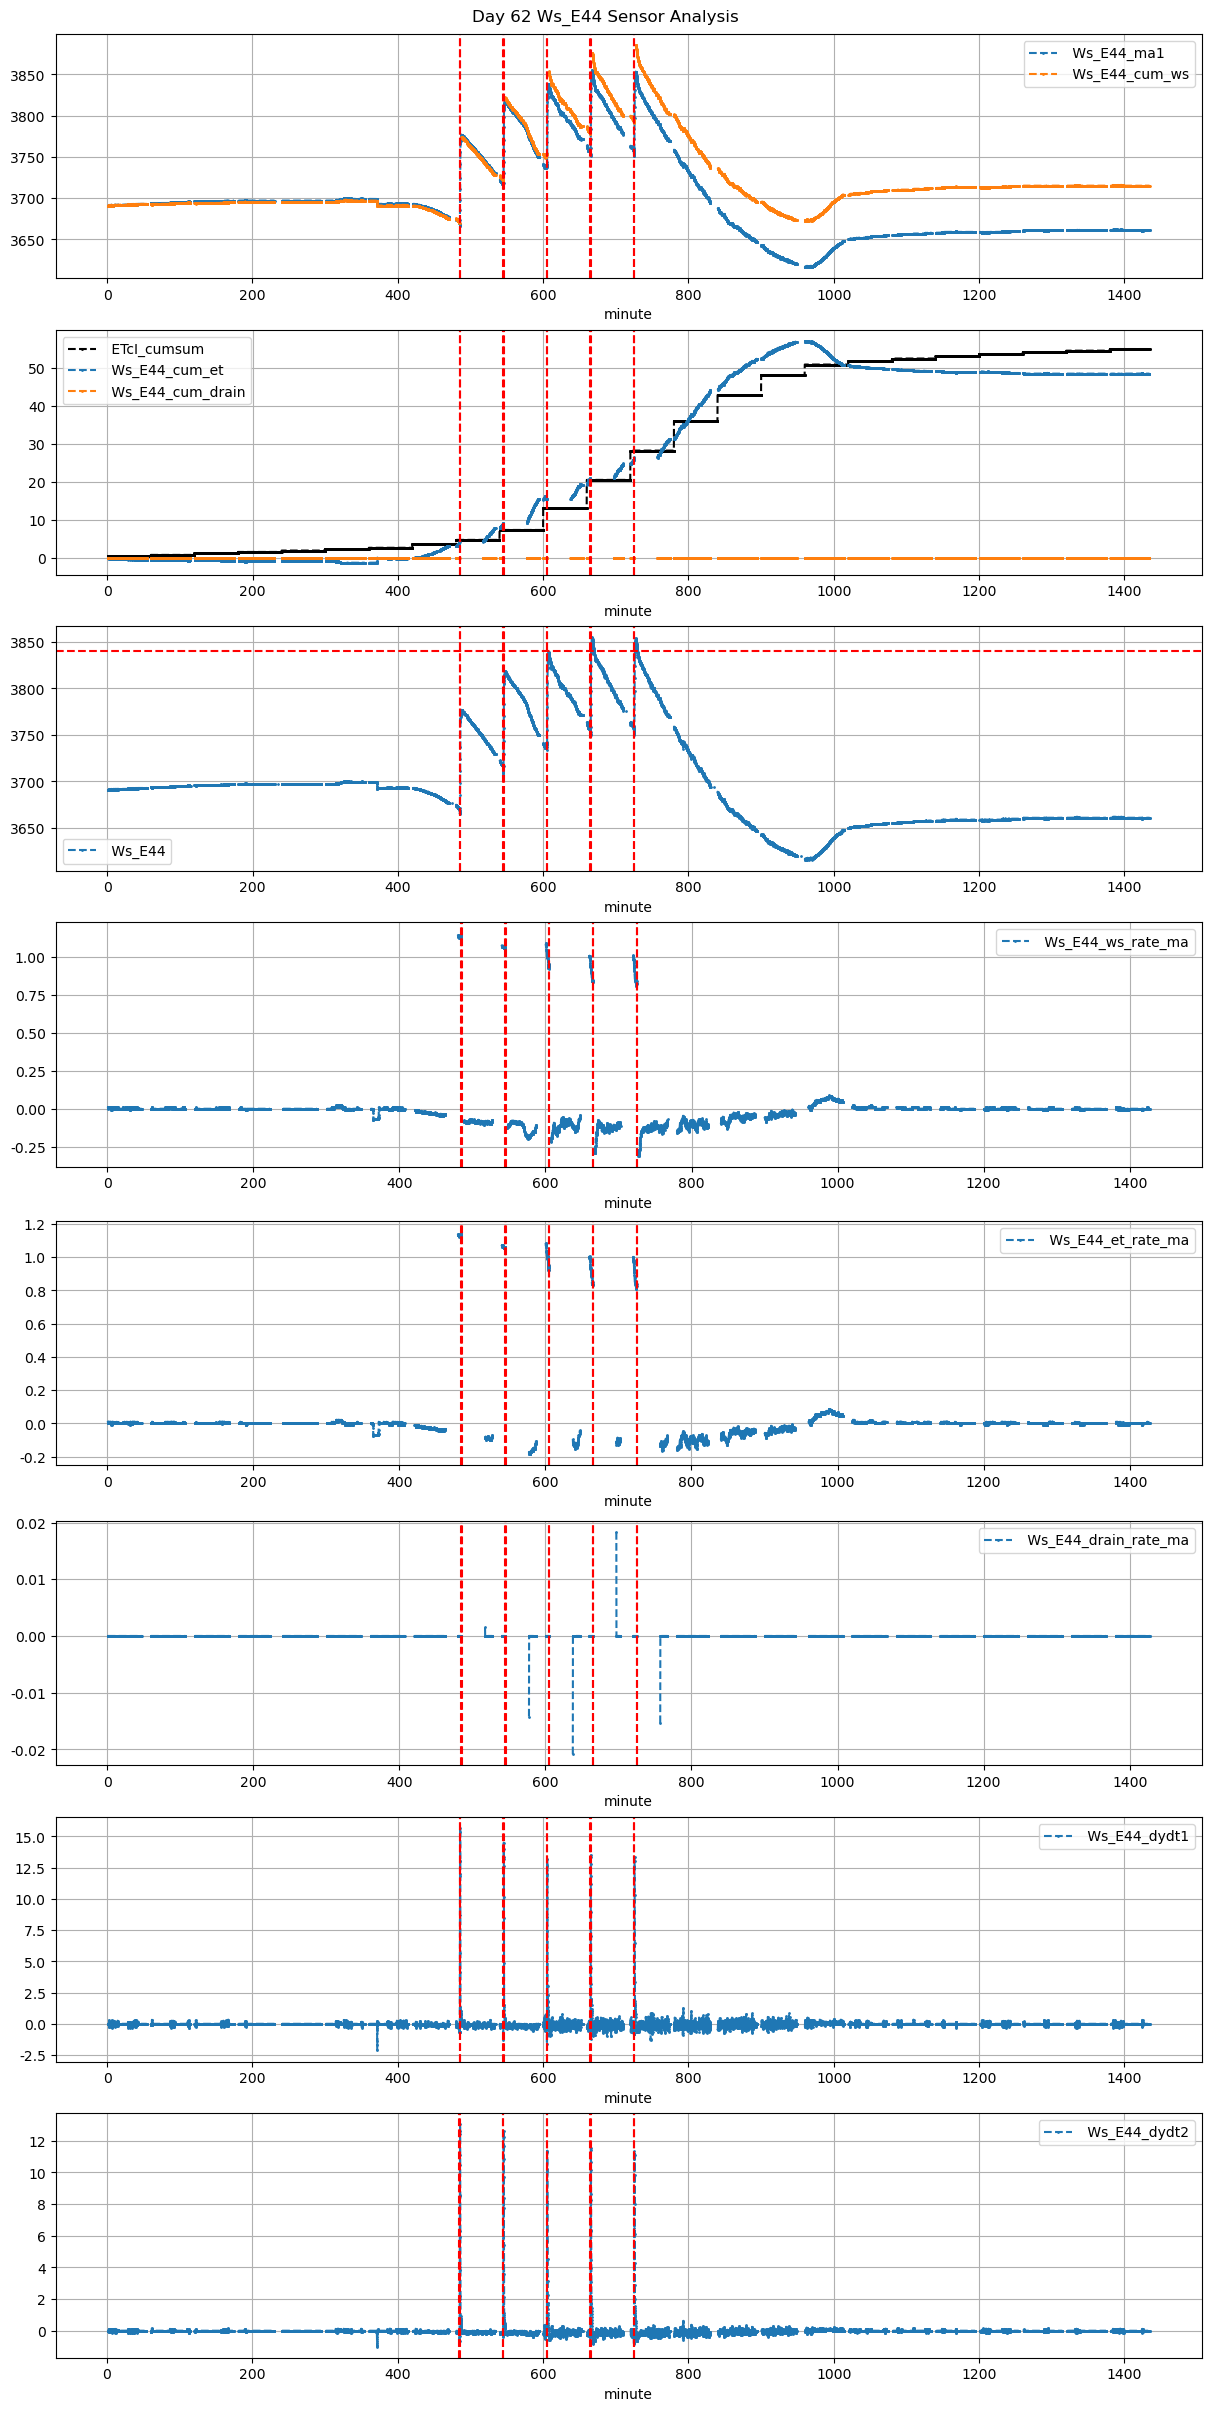
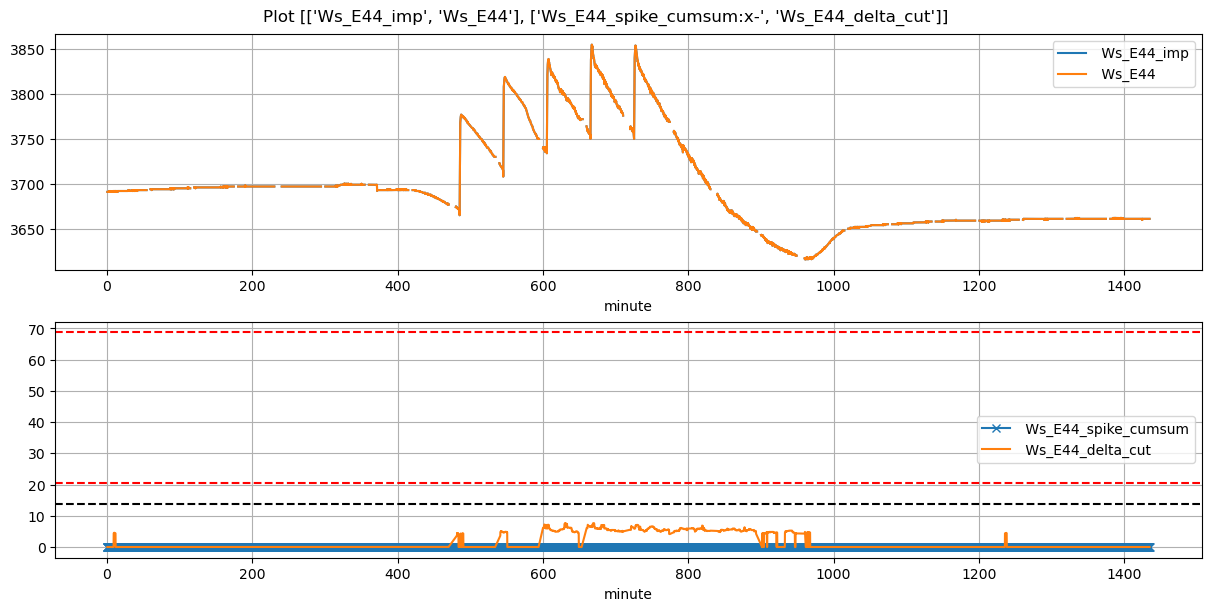
Ws_E44 |
0.456842 |
30 |
485.0 |
485.5 |
485.57 |
487.500000 |
3671.622222 |
3777.000000 |
34 |
NaN |
-0.086930 |
-0.088804 |
0.358333 |
0.619869 |
21.075556 |
True |
30.0 |
115.8 |
21.075556 |
0.0 |
0 |
0.0 |
NaN |
NaN |
NaN |
NaN |
NaN |
NaN |
| 2025-12-07 09:05:00+08:00 |
62 |
545 |
Ws_E44 |
0.456842 |
30 |
545.0 |
545.5 |
545.57 |
547.666667 |
3717.514286 |
3818.722222 |
34 |
NaN |
-0.098526 |
-0.170511 |
0.329500 |
0.595341 |
20.241587 |
True |
30.0 |
125.8 |
20.241587 |
0.0 |
0 |
0.0 |
NaN |
NaN |
NaN |
NaN |
NaN |
NaN |
| 2025-12-07 10:05:00+08:00 |
62 |
605 |
Ws_E44 |
0.456842 |
30 |
605.0 |
605.5 |
605.57 |
607.666667 |
3737.600000 |
3838.333333 |
34 |
NaN |
-0.149224 |
-0.093025 |
0.309000 |
0.592549 |
20.146667 |
True |
30.0 |
125.8 |
20.146667 |
0.0 |
0 |
0.0 |
NaN |
NaN |
NaN |
NaN |
NaN |
NaN |
| 2025-12-07 11:05:00+08:00 |
62 |
665 |
Ws_E44 |
0.456842 |
30 |
665.0 |
665.5 |
665.57 |
667.250000 |
3756.000000 |
3854.722222 |
34 |
NaN |
-0.154486 |
-0.126667 |
0.342000 |
0.580719 |
19.744444 |
True |
30.0 |
100.8 |
19.744444 |
0.0 |
0 |
0.0 |
NaN |
NaN |
NaN |
NaN |
NaN |
NaN |
| 2025-12-07 12:05:00+08:00 |
62 |
725 |
Ws_E44 |
0.456842 |
30 |
725.0 |
725.5 |
725.57 |
727.333333 |
3758.500000 |
3853.333333 |
34 |
NaN |
-0.190745 |
-0.118514 |
0.338200 |
0.557843 |
18.966667 |
True |
30.0 |
105.8 |
19.040000 |
0.0 |
0 |
0.0 |
NaN |
NaN |
NaN |
NaN |
NaN |
NaN |