| 2025-12-06 08:06:16+08:00 |
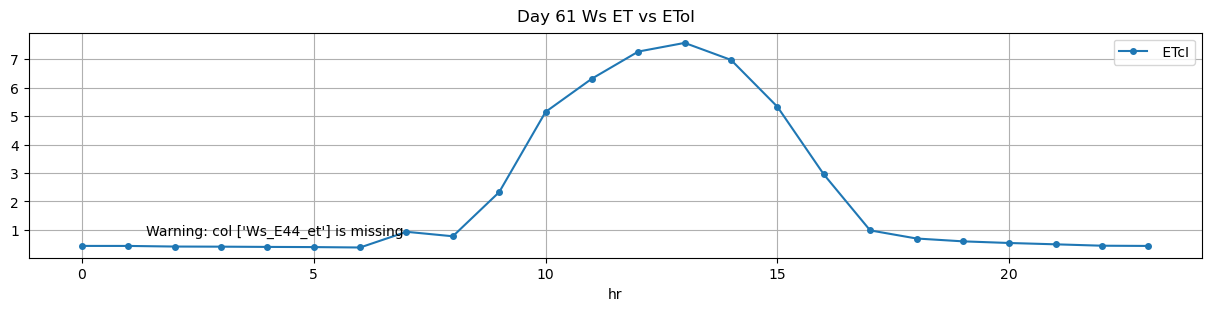
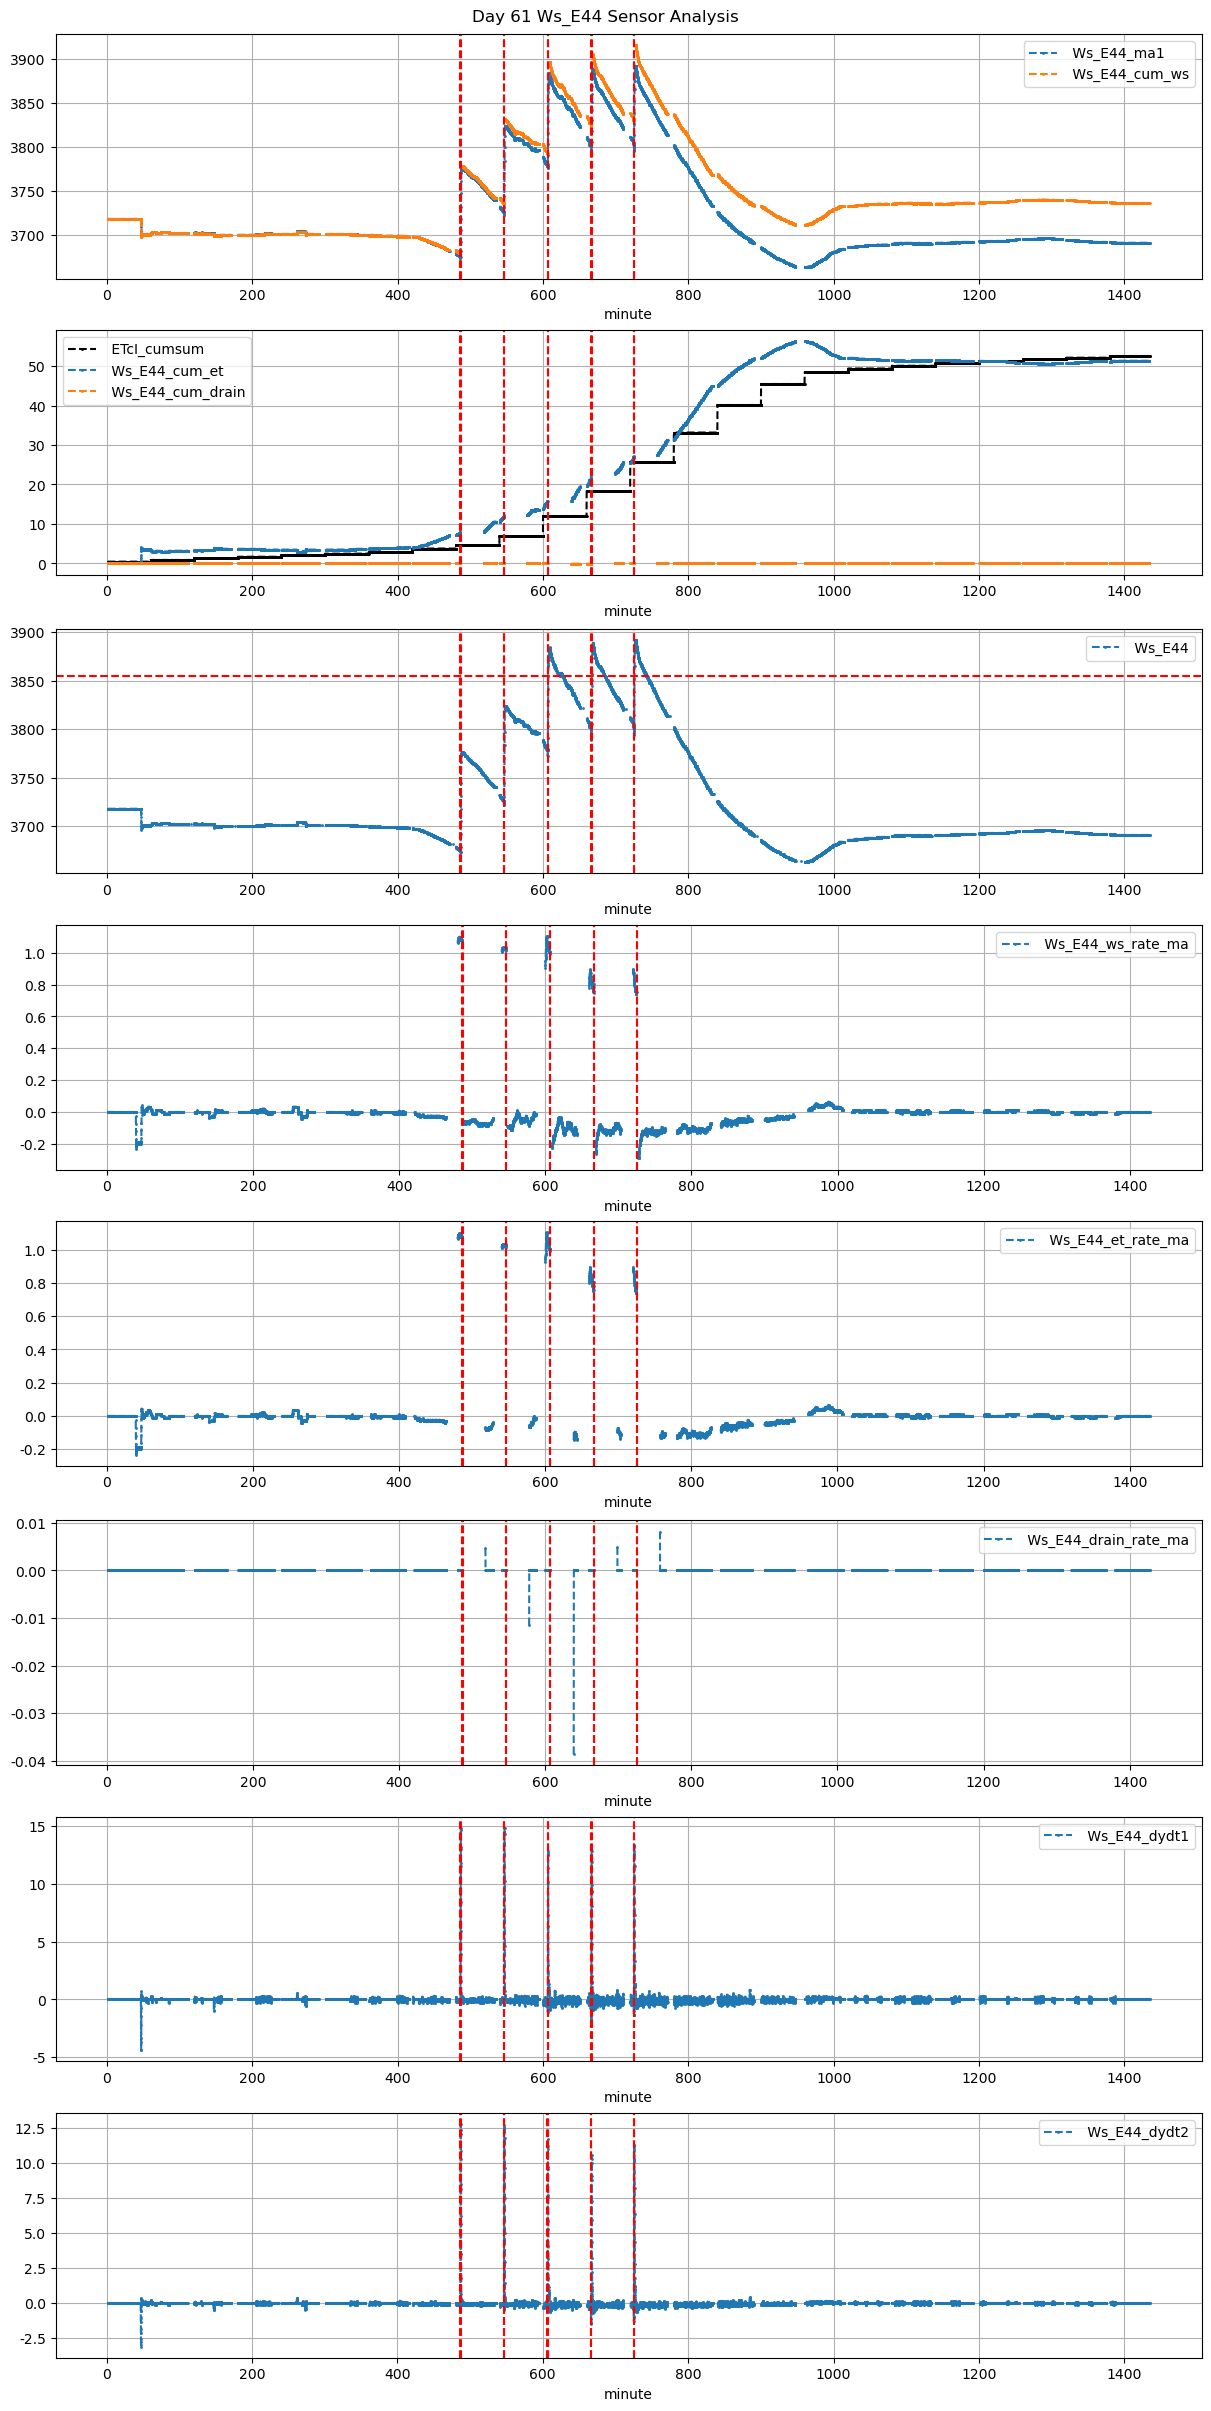
61 |
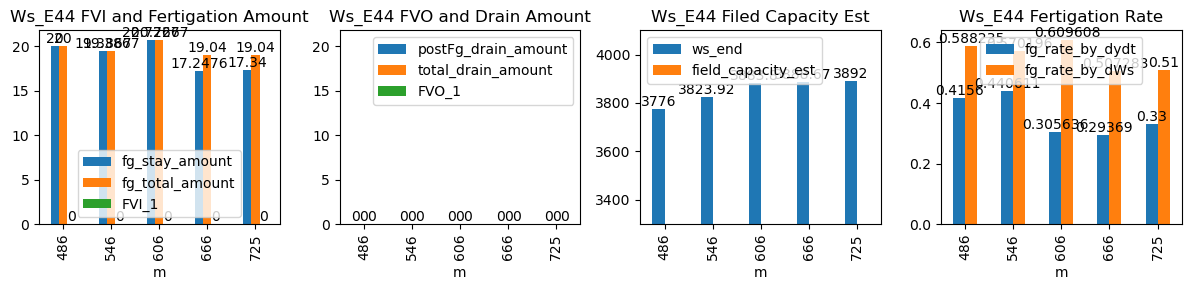
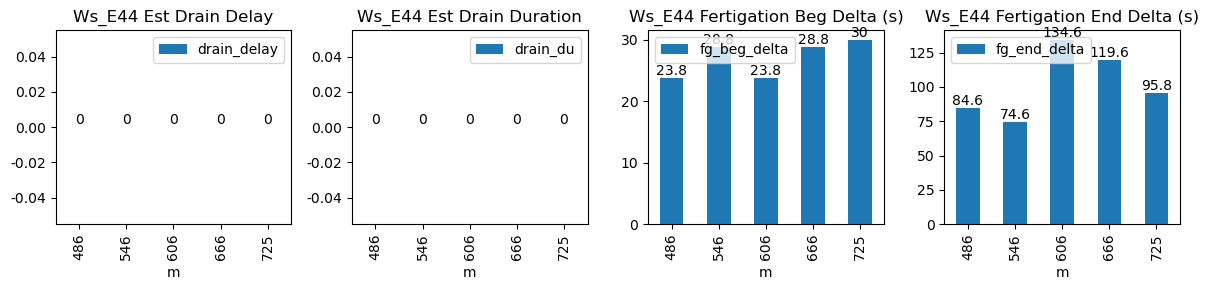
486 |
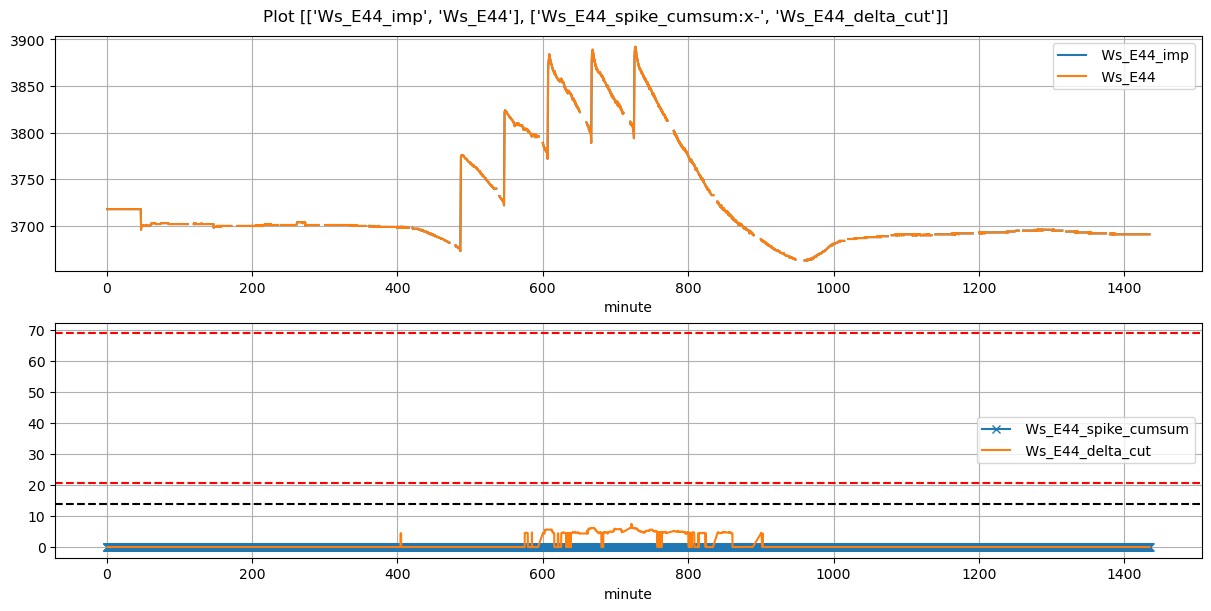
Ws_E44 |
0.501458 |
30 |
486.27 |
486.666667 |
486.84 |
488.250000 |
3676.000000 |
3776.000000 |
34 |
NaN |
-0.065741 |
-0.076852 |
0.415600 |
0.588235 |
20.000000 |
True |
23.8 |
84.6 |
20.000000 |
0.0 |
0 |
0.0 |
NaN |
NaN |
NaN |
NaN |
NaN |
NaN |
| 2025-12-06 09:06:16+08:00 |
61 |
546 |
Ws_E44 |
0.501458 |
30 |
546.27 |
546.750000 |
546.84 |
548.083333 |
3726.983333 |
3823.916667 |
34 |
NaN |
-0.093549 |
-0.052377 |
0.440611 |
0.570196 |
19.386667 |
True |
28.8 |
74.6 |
19.386667 |
0.0 |
0 |
0.0 |
NaN |
NaN |
NaN |
NaN |
NaN |
NaN |
| 2025-12-06 10:06:16+08:00 |
61 |
606 |
Ws_E44 |
0.501458 |
30 |
606.27 |
606.666667 |
606.84 |
609.083333 |
3780.166667 |
3883.800000 |
34 |
NaN |
-0.143778 |
-0.100278 |
0.305636 |
0.609608 |
20.726667 |
True |
23.8 |
134.6 |
20.726667 |
0.0 |
0 |
0.0 |
NaN |
NaN |
NaN |
NaN |
NaN |
NaN |
| 2025-12-06 11:06:16+08:00 |
61 |
666 |
Ws_E44 |
0.501458 |
30 |
666.27 |
666.750000 |
666.84 |
668.833333 |
3802.428571 |
3888.666667 |
34 |
NaN |
-0.133111 |
-0.096564 |
0.293690 |
0.507283 |
17.247619 |
True |
28.8 |
119.6 |
19.040000 |
0.0 |
0 |
0.0 |
NaN |
NaN |
NaN |
NaN |
NaN |
NaN |
| 2025-12-06 12:05:00+08:00 |
61 |
725 |
Ws_E44 |
0.501458 |
30 |
725.00 |
725.500000 |
725.57 |
727.166667 |
3805.300000 |
3892.000000 |
34 |
NaN |
-0.179846 |
-0.129612 |
0.330000 |
0.510000 |
17.340000 |
True |
30.0 |
95.8 |
19.040000 |
0.0 |
0 |
0.0 |
NaN |
NaN |
NaN |
NaN |
NaN |
NaN |