| 2025-12-30 08:36:05+08:00 |
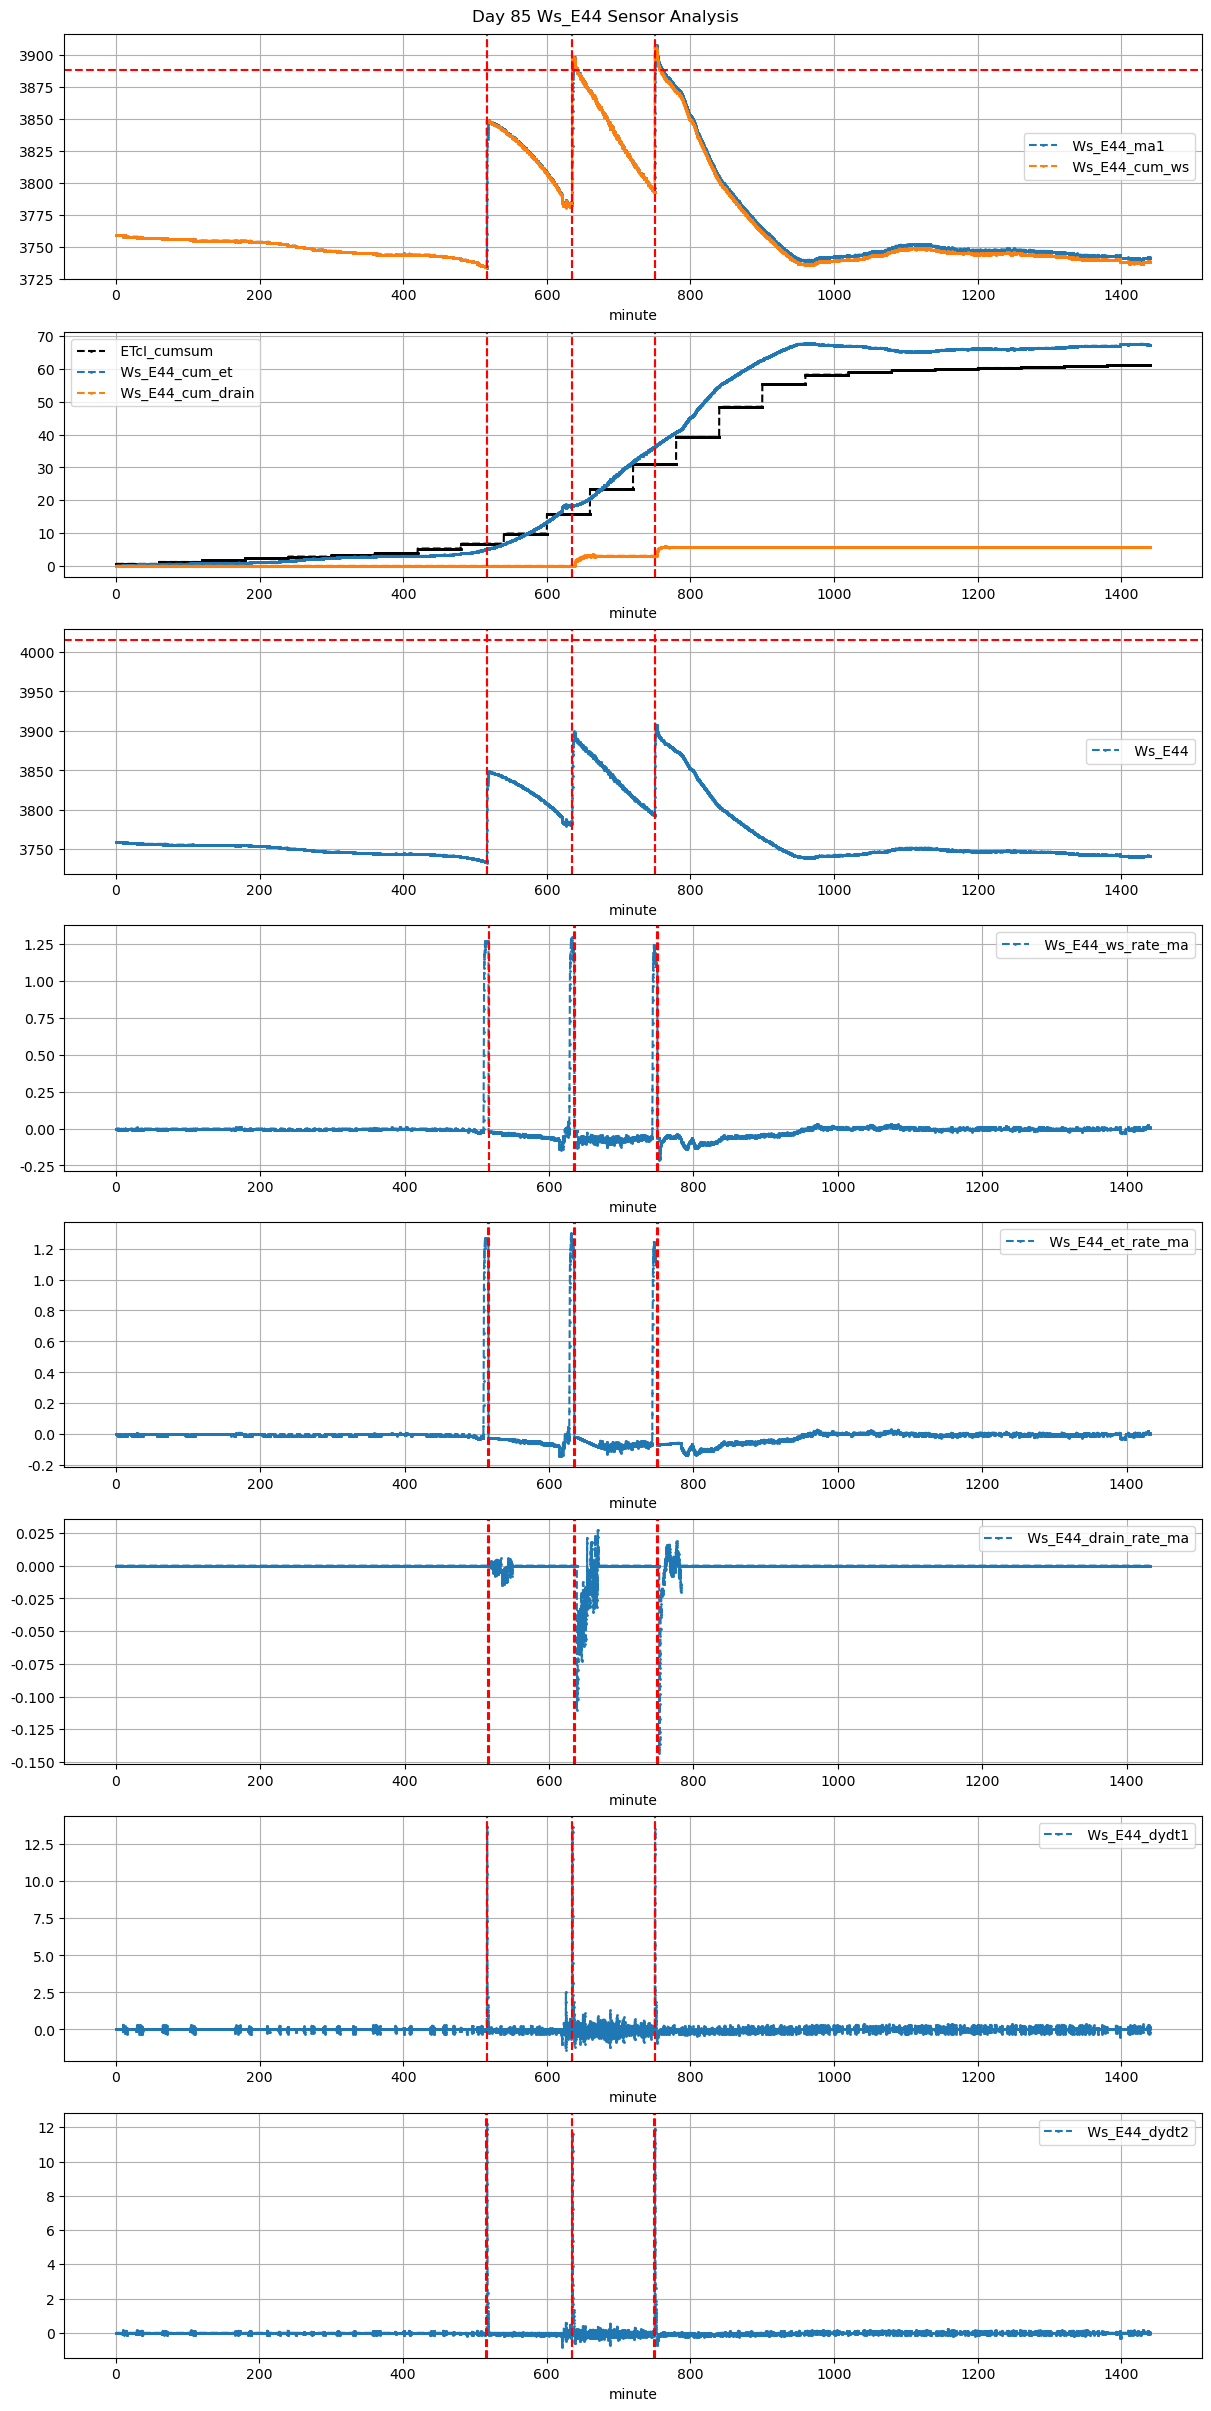
85 |
516 |
Ws_E44 |
0.309012 |
30 |
516.08 |
516.583333 |
516.65 |
518.916667 |
3734.000000 |
3848.833333 |
34 |
-0.023004 |
-0.024873 |
-0.035864 |
0.324667 |
0.675490 |
22.966667 |
True |
30.2 |
136.0 |
22.966667 |
0.0 |
0.000000 |
0.000000 |
474 |
1106 |
-0.012718 |
NaN |
NaN |
NaN |
| 2025-12-30 10:35:00+08:00 |
85 |
635 |
Ws_E44 |
0.309012 |
30 |
635.00 |
635.500000 |
635.57 |
638.500000 |
3782.666667 |
3898.333333 |
34 |
-0.018945 |
-0.084412 |
-0.081780 |
0.256333 |
0.680392 |
23.133333 |
True |
30.0 |
175.8 |
23.133333 |
0.0 |
3.147064 |
3.147064 |
844 |
180 |
-0.072781 |
3882.598015 |
NaN |
NaN |
| 2025-12-30 12:30:00+08:00 |
85 |
750 |
Ws_E44 |
0.309012 |
30 |
750.00 |
750.416667 |
750.57 |
752.583333 |
3794.260317 |
3907.750000 |
34 |
-0.066598 |
-0.104691 |
-0.053580 |
0.347667 |
0.667586 |
22.697937 |
True |
25.0 |
120.8 |
22.697937 |
0.0 |
2.630339 |
2.630339 |
465 |
125 |
-0.119632 |
3894.598306 |
NaN |
NaN |