| 2025-12-29 09:30:00+08:00 |
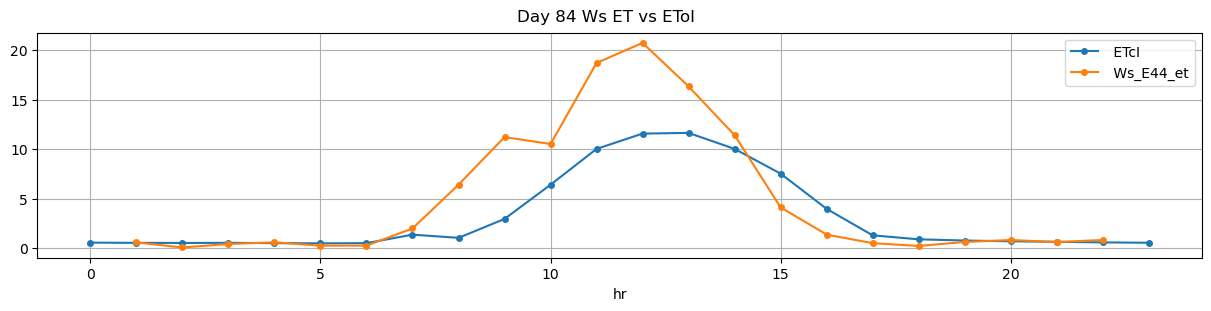
84 |
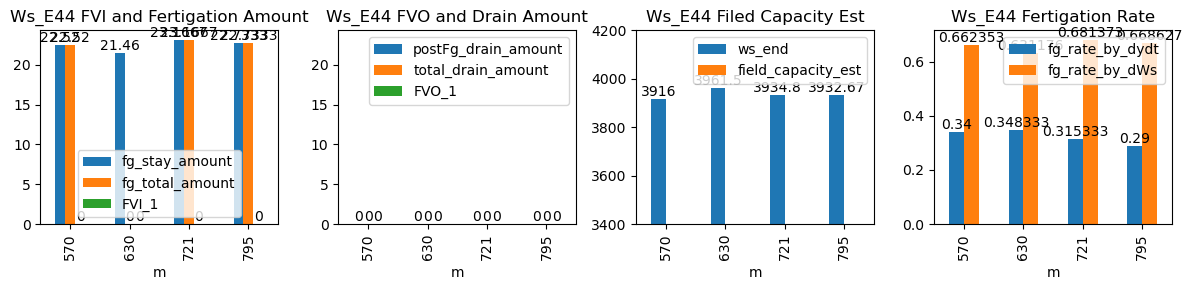
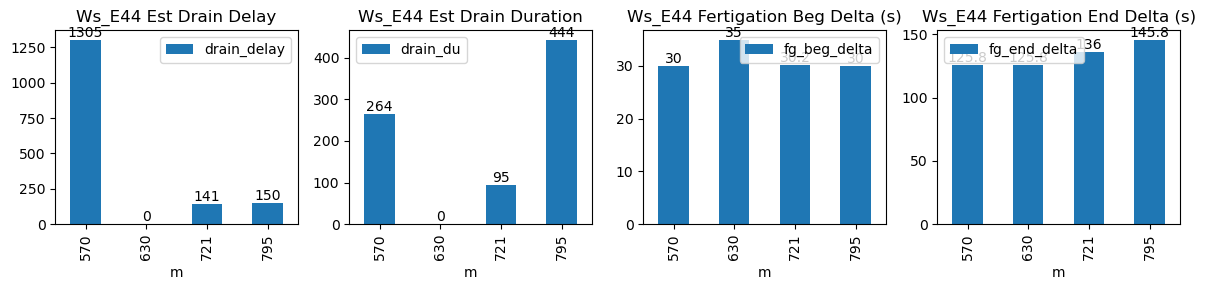
570 |
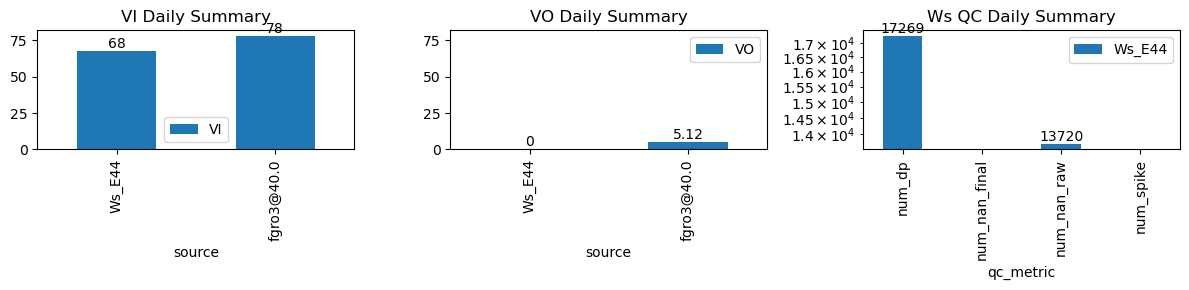
Ws_E44 |
0.369063 |
30 |
570.00 |
570.500000 |
570.57 |
572.666667 |
3803.400000 |
3916.000000 |
34 |
-0.076966 |
-0.070048 |
-0.098272 |
0.340000 |
0.662353 |
22.520000 |
True |
30.0 |
125.8 |
22.520000 |
0.0 |
0.0 |
0.0 |
264.0 |
1305.0 |
-0.017156 |
NaN |
NaN |
NaN |
| 2025-12-29 10:30:00+08:00 |
84 |
630 |
Ws_E44 |
0.369063 |
30 |
630.00 |
630.583333 |
630.57 |
632.666667 |
3854.200000 |
3961.500000 |
34 |
-0.044405 |
-0.140838 |
-0.044405 |
0.348333 |
0.631176 |
21.460000 |
False |
35.0 |
125.8 |
NaN |
NaN |
NaN |
NaN |
NaN |
NaN |
NaN |
NaN |
NaN |
NaN |
| 2025-12-29 12:01:05+08:00 |
84 |
721 |
Ws_E44 |
0.369063 |
30 |
721.08 |
721.583333 |
721.65 |
723.916667 |
3818.966667 |
3934.800000 |
34 |
-0.150988 |
-0.158210 |
-0.139352 |
0.315333 |
0.681373 |
23.166667 |
True |
30.2 |
136.0 |
23.166667 |
0.0 |
0.0 |
0.0 |
95.0 |
141.0 |
-0.057665 |
NaN |
NaN |
NaN |
| 2025-12-29 13:15:00+08:00 |
84 |
795 |
Ws_E44 |
0.369063 |
30 |
795.00 |
795.500000 |
795.57 |
798.000000 |
3819.000000 |
3932.666667 |
34 |
-0.102385 |
-0.147370 |
-0.129660 |
0.290000 |
0.668627 |
22.733333 |
True |
30.0 |
145.8 |
22.733333 |
0.0 |
0.0 |
0.0 |
444.0 |
150.0 |
-0.076136 |
NaN |
NaN |
NaN |