VI and VO Daily Summary

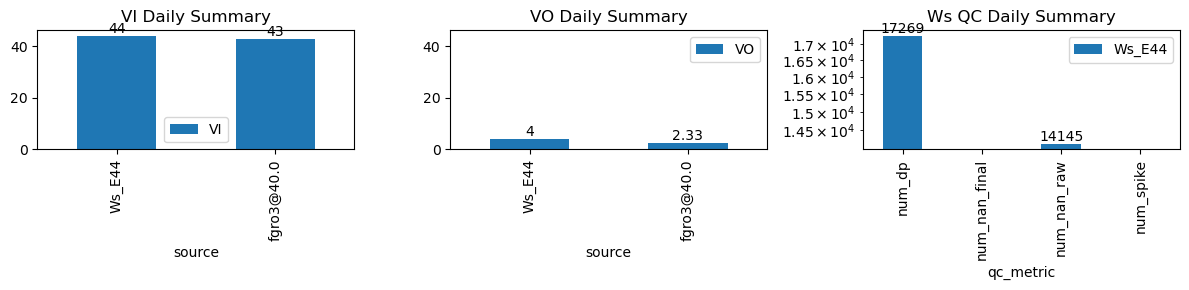
| ws_name | num_dp | num_nan_raw | num_nan_final | num_spike | cum_step_adj |
|---|---|---|---|---|---|
| Ws_E44 | 17,269 | 14,145 | 0 | 0 | 0.00 |
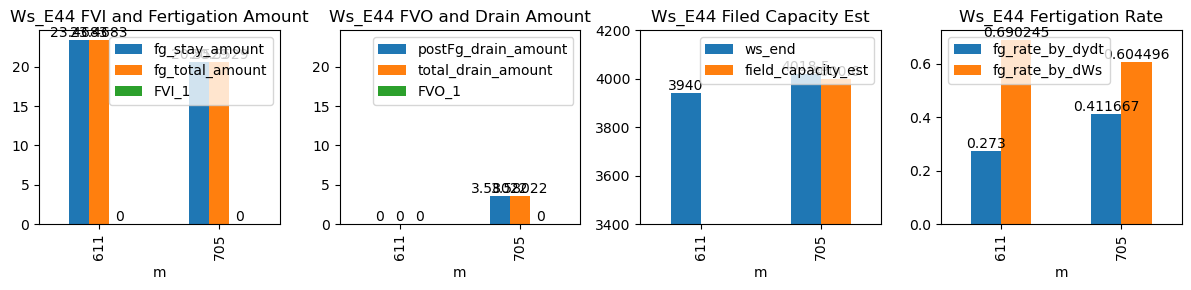
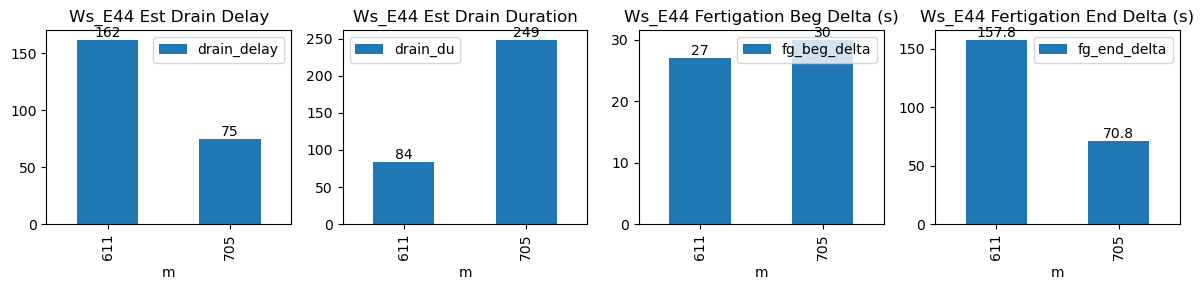
| ds | d | m | ws_name | prominence_cut | max_drain_du | fg_beg | fg_beg_est | fg_end | fg_end_est | ws_beg | ws_end | duc | pre_fg_et | post_fg_ws | post_drn_et | fg_rate_by_dydt | fg_rate_by_dWs | fg_stay_amount | enough_data | fg_beg_delta | fg_end_delta | fg_total_amount | fg_drain_amount | postFg_drain_amount | total_drain_amount | drain_du | drain_delay | drain_rate | field_capacity_est | FVI_1 | FVO_1 |
|---|---|---|---|---|---|---|---|---|---|---|---|---|---|---|---|---|---|---|---|---|---|---|---|---|---|---|---|---|---|---|---|
| 2025-12-23 10:11:03+08:00 | 78 | 611 | Ws_E44 | 0.211952 | 30 | 611.05 | 611.5 | 611.62 | 614.25 | 3822.658333 | 3940.0 | 34 | -0.025123 | -0.019835 | -0.026284 | 0.273000 | 0.690245 | 23.468333 | True | 27.0 | 157.8 | 23.468333 | 0.0 | 0.000000 | 0.000000 | 84 | 162 | -0.020433 | NaN | NaN | NaN |
| 2025-12-23 11:45:00+08:00 | 78 | 705 | Ws_E44 | 0.211952 | 30 | 705.00 | 705.5 | 705.57 | 706.75 | 3915.735714 | 4018.5 | 34 | -0.016167 | -0.076173 | -0.030291 | 0.411667 | 0.604496 | 20.552857 | True | 30.0 | 70.8 | 20.552857 | 0.0 | 3.580216 | 3.580216 | 249 | 75 | -0.147604 | 4000.598921 | NaN | NaN |