VI and VO Daily Summary
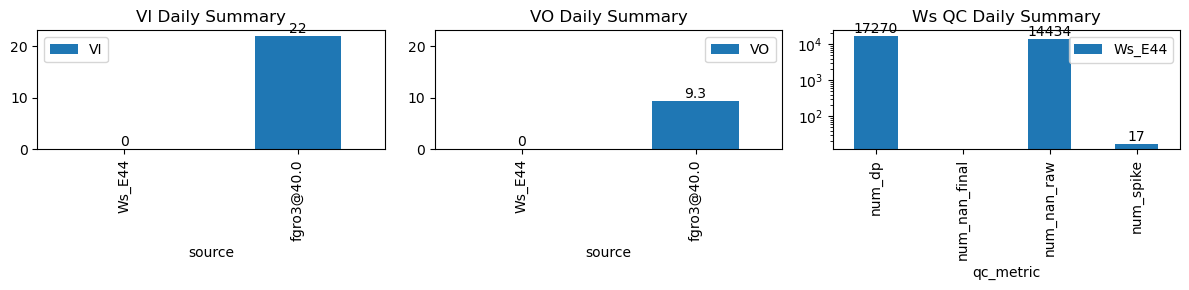
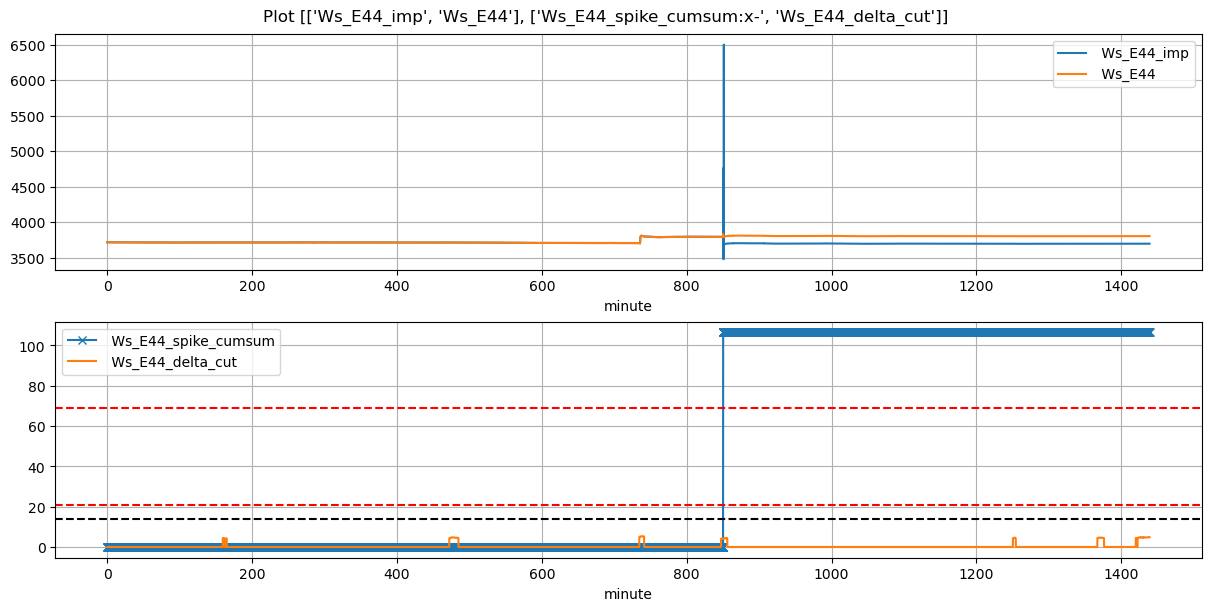
| ws_name | num_dp | num_nan_raw | num_nan_final | num_spike | cum_step_adj |
|---|---|---|---|---|---|
| Ws_E44 | 17,270 | 14,434 | 0 | 17 | 106.50 |
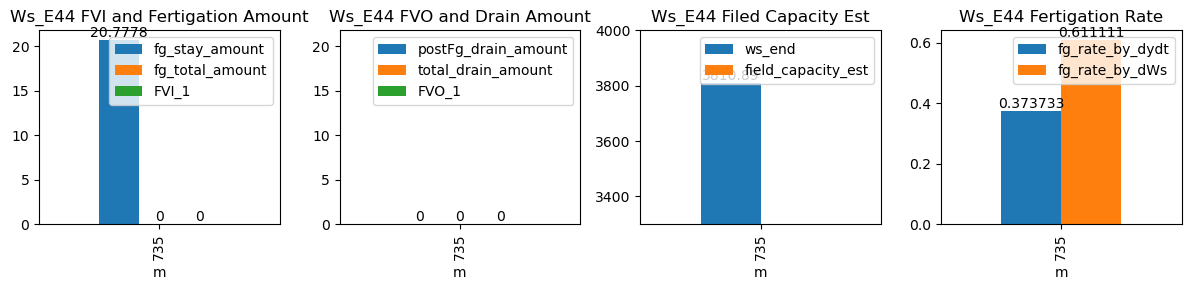
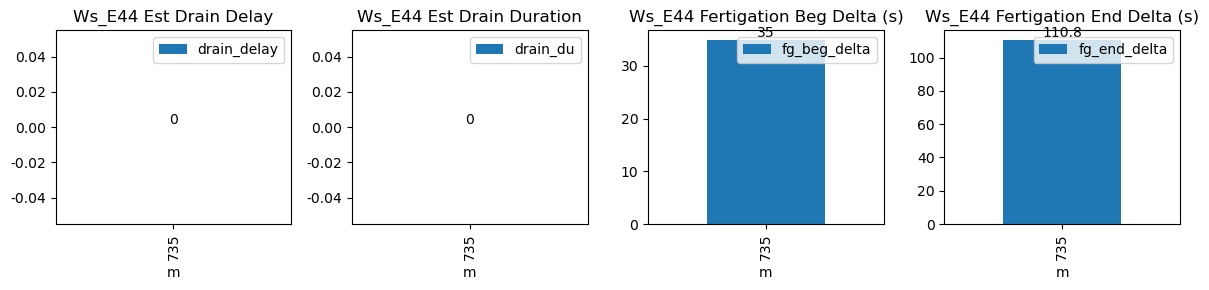
| ds | d | m | ws_name | prominence_cut | max_drain_du | fg_beg | fg_beg_est | fg_end | fg_end_est | ws_beg | ws_end | duc | pre_fg_et | post_fg_ws | post_drn_et | fg_rate_by_dydt | fg_rate_by_dWs | fg_stay_amount | enough_data | fg_beg_delta | fg_end_delta | fg_total_amount | fg_drain_amount | postFg_drain_amount | total_drain_amount | drain_du | drain_delay | drain_rate | field_capacity_est | FVI_1 | FVO_1 |
|---|---|---|---|---|---|---|---|---|---|---|---|---|---|---|---|---|---|---|---|---|---|---|---|---|---|---|---|---|---|---|---|
| 2025-12-13 12:15:00+08:00 | 68 | 735 | Ws_E44 | 0.219813 | 30 | 735.0 | 735.583333 | 735.57 | 737.416667 | 3707.0 | 3810.888889 | 34 | -0.009704 | -0.065432 | -0.009704 | 0.373733 | 0.611111 | 20.777778 | False | 35.0 | 110.8 | NaN | NaN | NaN | NaN | NaN | NaN | NaN | NaN | NaN | NaN |