| 2025-12-03 08:05:00+08:00 |
58 |
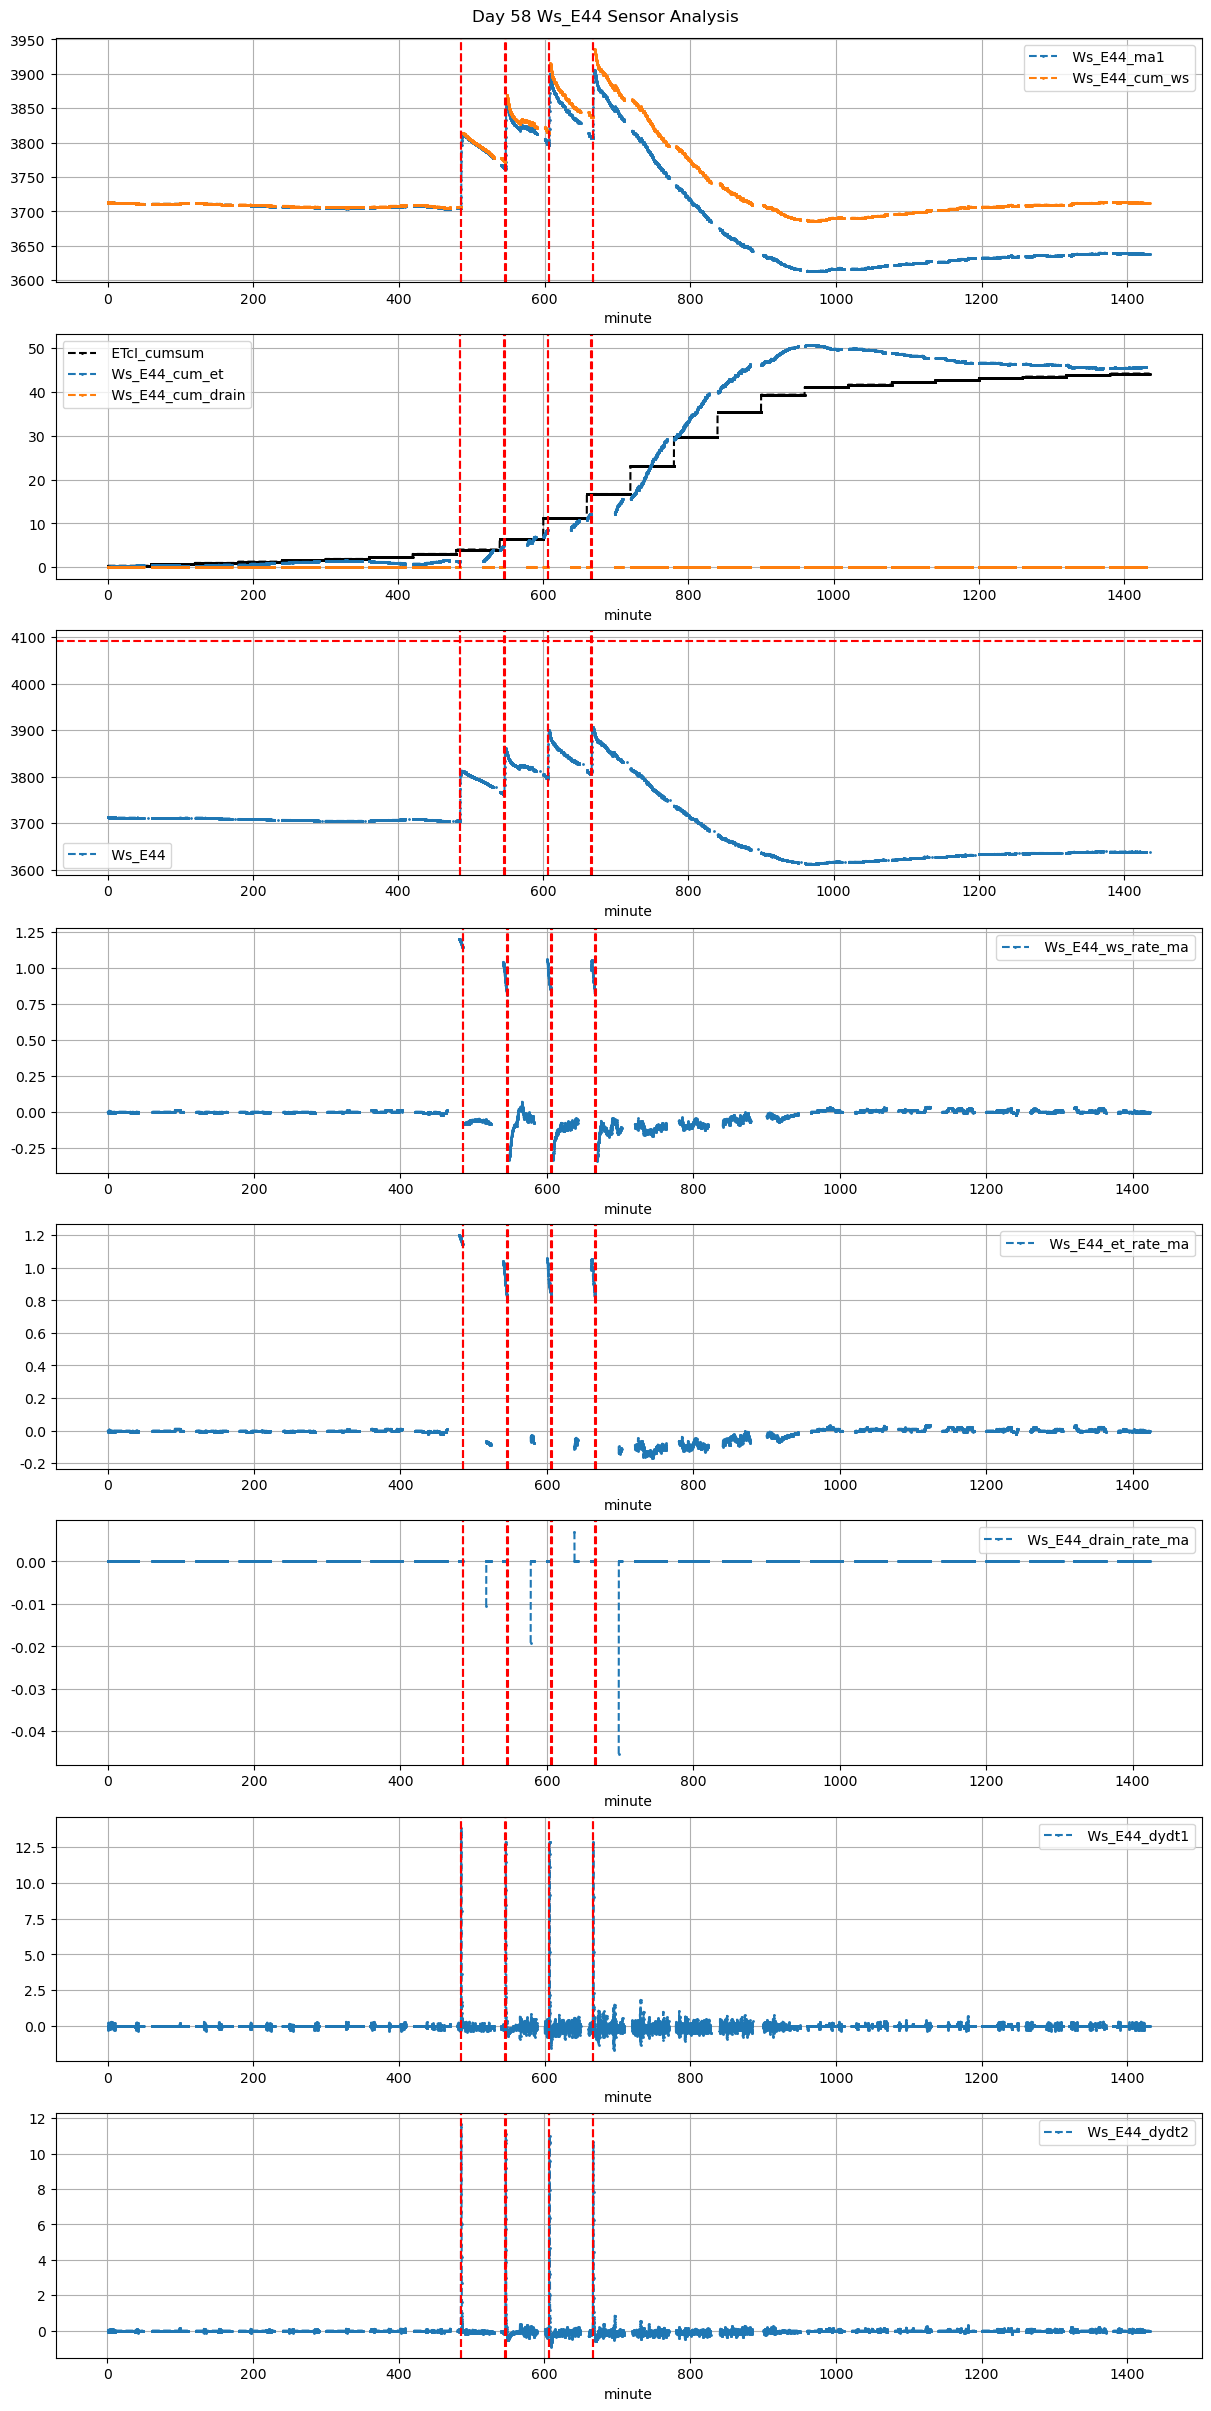
485 |
Ws_E44 |
0.42241 |
30 |
485.00 |
485.333333 |
485.60 |
487.25 |
3705.0 |
3813.000000 |
36 |
NaN |
-0.078525 |
-0.063148 |
0.354286 |
0.600000 |
21.600000 |
True |
20.0 |
99.0 |
23.004 |
0.0 |
0 |
0.0 |
NaN |
NaN |
NaN |
NaN |
NaN |
NaN |
| 2025-12-03 09:06:08+08:00 |
58 |
546 |
Ws_E44 |
0.42241 |
30 |
546.13 |
546.500000 |
546.73 |
548.00 |
3763.0 |
3860.722222 |
36 |
NaN |
-0.193263 |
-0.036511 |
0.376000 |
0.542901 |
19.544444 |
True |
22.2 |
76.2 |
23.004 |
0.0 |
0 |
0.0 |
NaN |
NaN |
NaN |
NaN |
NaN |
NaN |
| 2025-12-03 10:06:08+08:00 |
58 |
606 |
Ws_E44 |
0.42241 |
30 |
606.13 |
606.500000 |
606.73 |
607.75 |
3798.0 |
3899.500000 |
36 |
NaN |
-0.202891 |
-0.095936 |
0.382857 |
0.563889 |
20.300000 |
True |
22.2 |
61.2 |
23.004 |
0.0 |
0 |
0.0 |
NaN |
NaN |
NaN |
NaN |
NaN |
NaN |
| 2025-12-03 11:06:08+08:00 |
58 |
666 |
Ws_E44 |
0.42241 |
30 |
666.13 |
666.500000 |
666.73 |
668.25 |
3806.6 |
3905.800000 |
36 |
NaN |
-0.178457 |
-0.097037 |
0.345143 |
0.551111 |
19.840000 |
True |
22.2 |
91.2 |
23.004 |
0.0 |
0 |
0.0 |
NaN |
NaN |
NaN |
NaN |
NaN |
NaN |