| 2025-12-04 08:45:00+08:00 |
59 |
525 |
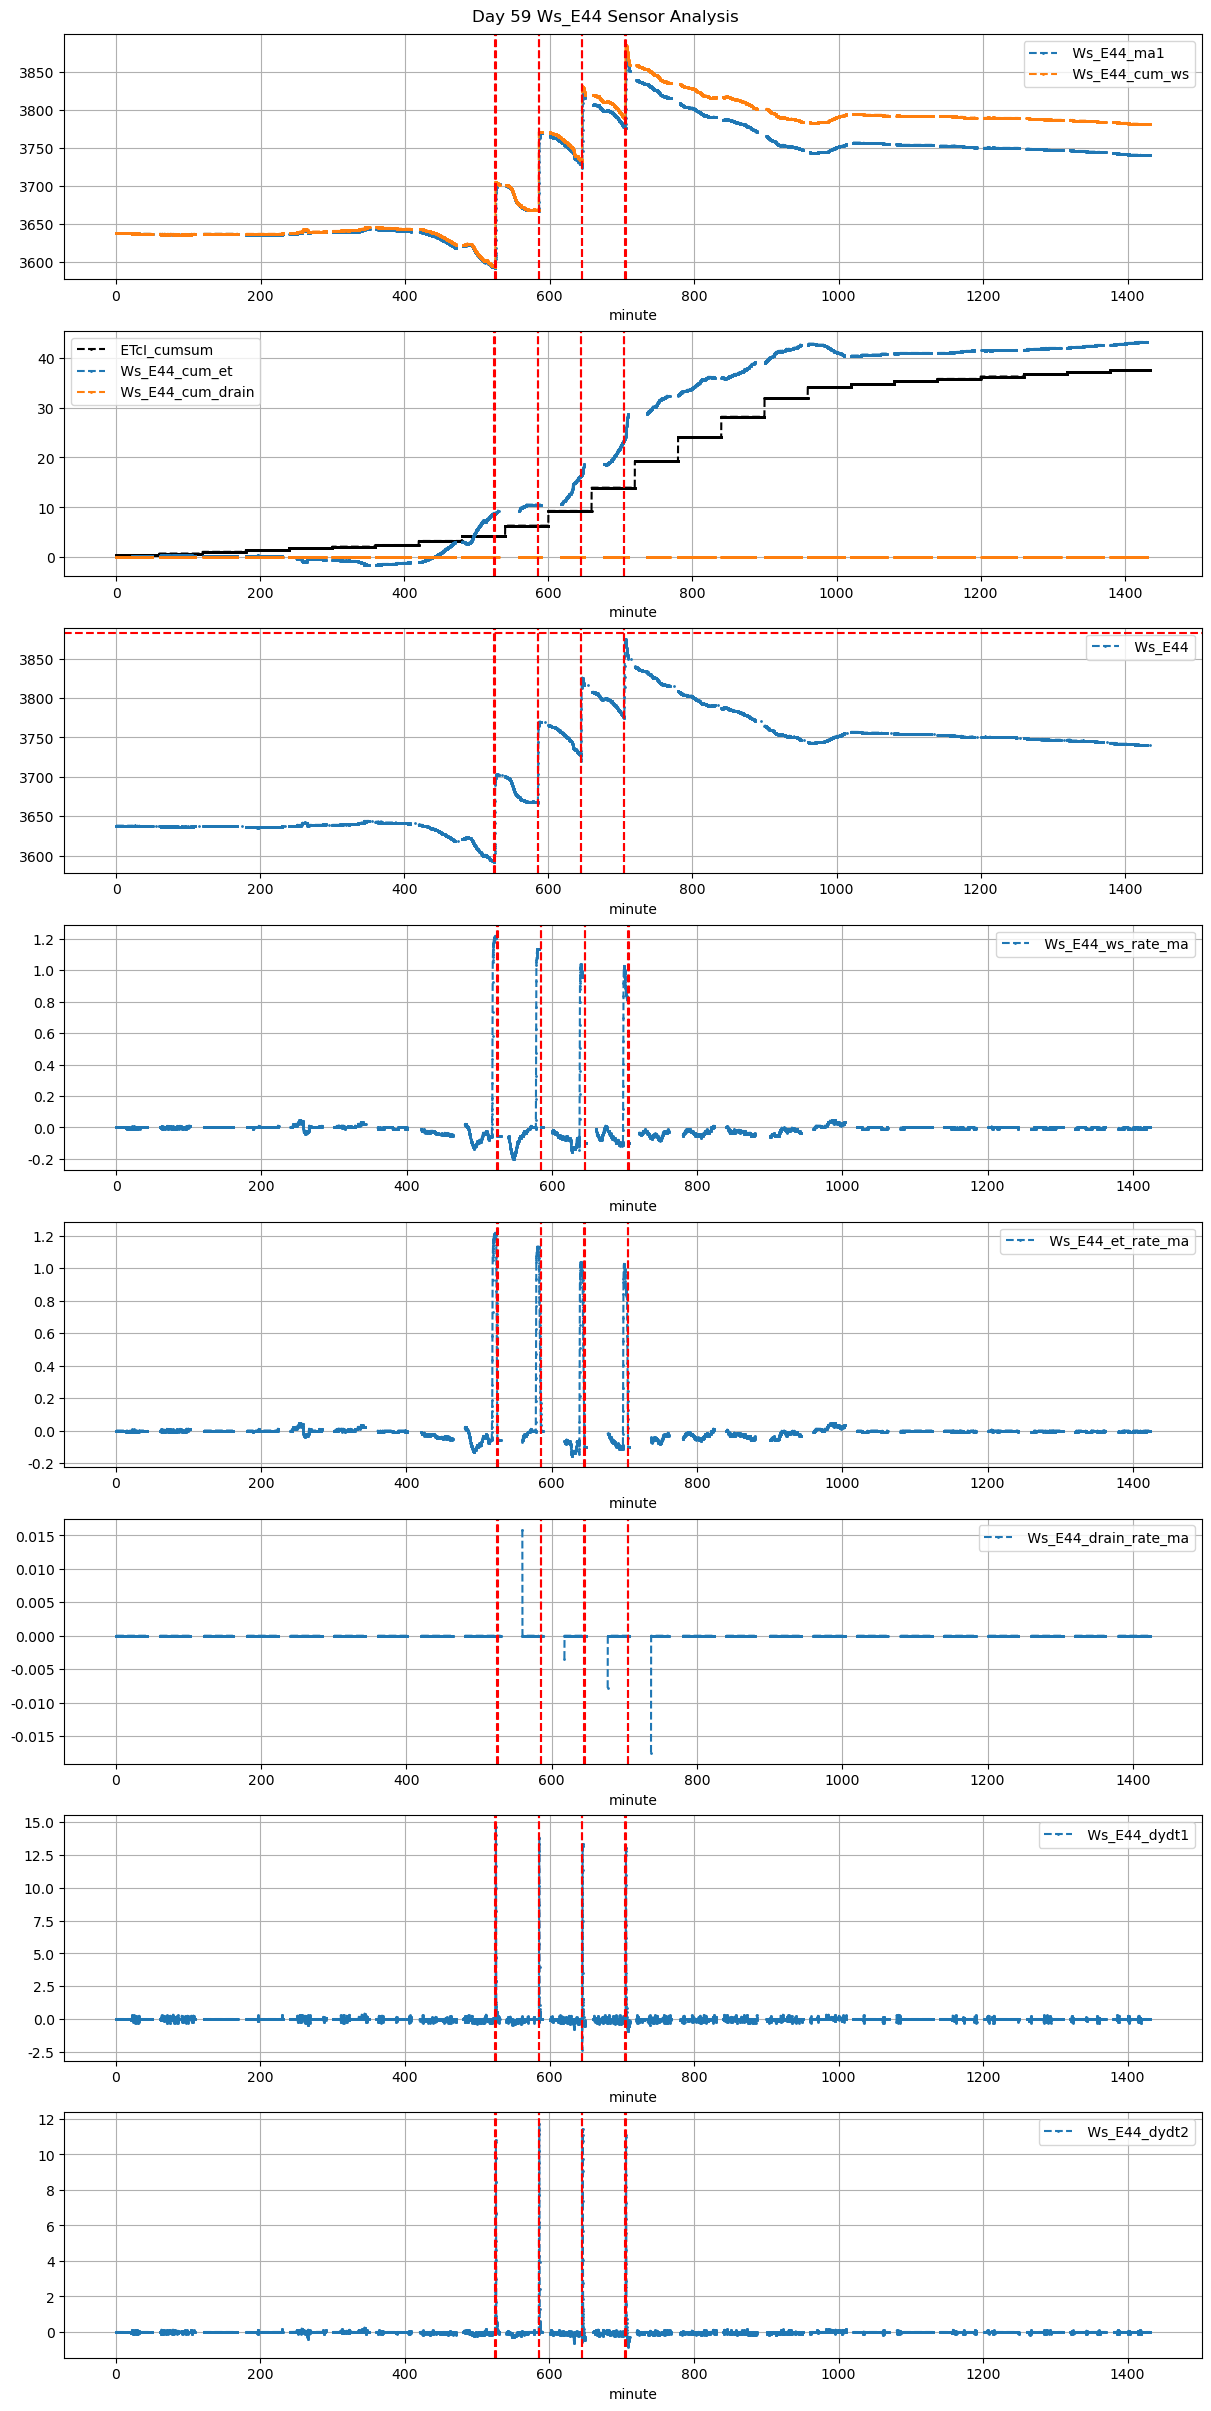
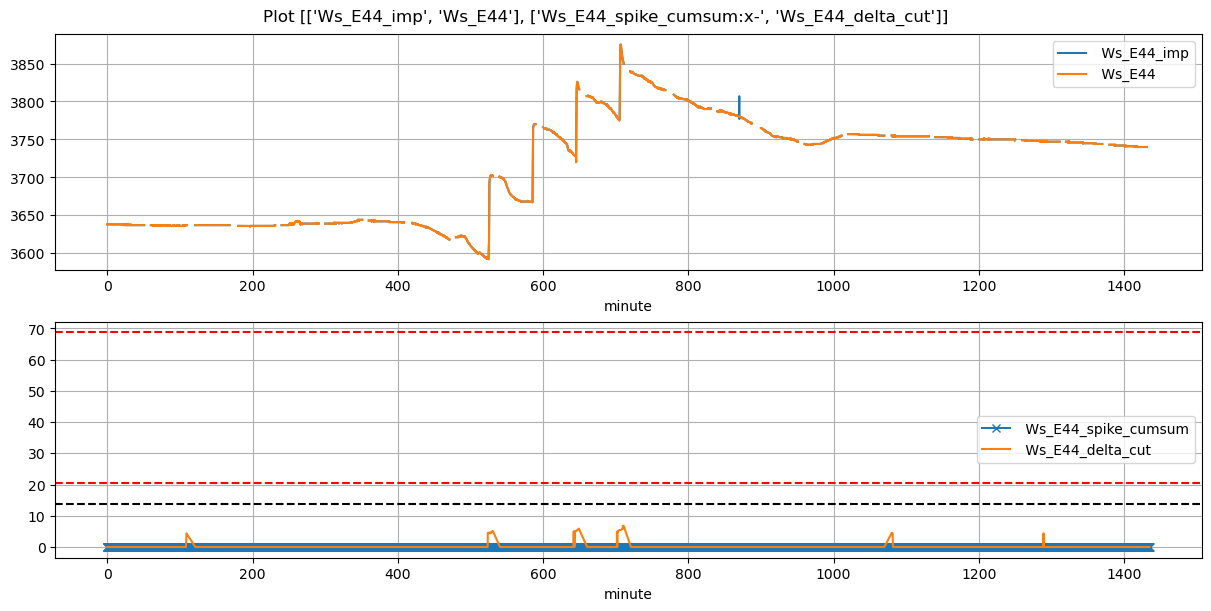
Ws_E44 |
0.287788 |
30 |
525.0 |
525.083333 |
525.6 |
529.583333 |
3593.000 |
3702.833333 |
36 |
-0.057155 |
NaN |
-0.071420 |
0.133575 |
0.610185 |
21.966667 |
True |
5.0 |
239.0 |
23.004 |
0.0 |
0 |
0.0 |
NaN |
NaN |
NaN |
NaN |
NaN |
NaN |
| 2025-12-04 09:45:00+08:00 |
59 |
585 |
Ws_E44 |
0.287788 |
30 |
585.0 |
585.500000 |
585.6 |
587.500000 |
3668.000 |
3770.000000 |
36 |
0.000000 |
NaN |
-0.063215 |
0.335571 |
0.566667 |
20.400000 |
True |
30.0 |
114.0 |
23.004 |
0.0 |
0 |
0.0 |
NaN |
NaN |
NaN |
NaN |
NaN |
NaN |
| 2025-12-04 10:45:00+08:00 |
59 |
645 |
Ws_E44 |
0.287788 |
30 |
645.0 |
645.500000 |
645.6 |
647.083333 |
3729.000 |
3825.750000 |
36 |
-0.099429 |
NaN |
-0.014414 |
0.368286 |
0.537500 |
19.350000 |
True |
30.0 |
89.0 |
23.004 |
0.0 |
0 |
0.0 |
NaN |
NaN |
NaN |
NaN |
NaN |
NaN |
| 2025-12-04 11:45:00+08:00 |
59 |
705 |
Ws_E44 |
0.287788 |
30 |
705.0 |
705.416667 |
705.6 |
706.750000 |
3777.325 |
3875.000000 |
36 |
-0.101483 |
NaN |
-0.042222 |
0.390857 |
0.542639 |
19.535000 |
True |
25.0 |
69.0 |
23.004 |
0.0 |
0 |
0.0 |
NaN |
NaN |
NaN |
NaN |
NaN |
NaN |