| 2025-11-24 08:50:00+08:00 |
49 |
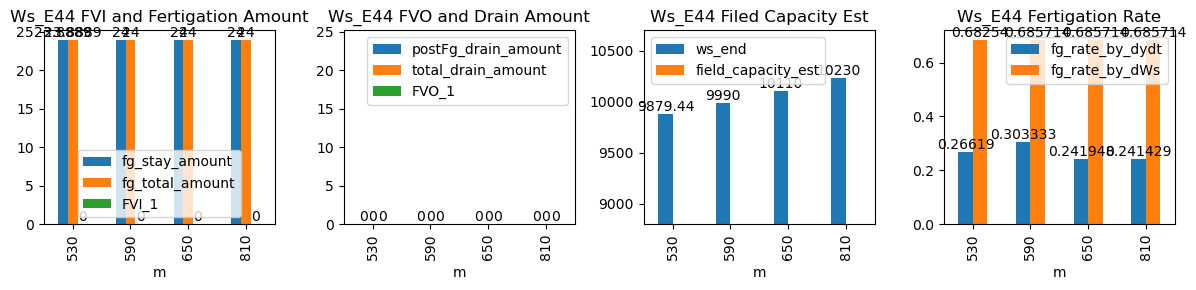
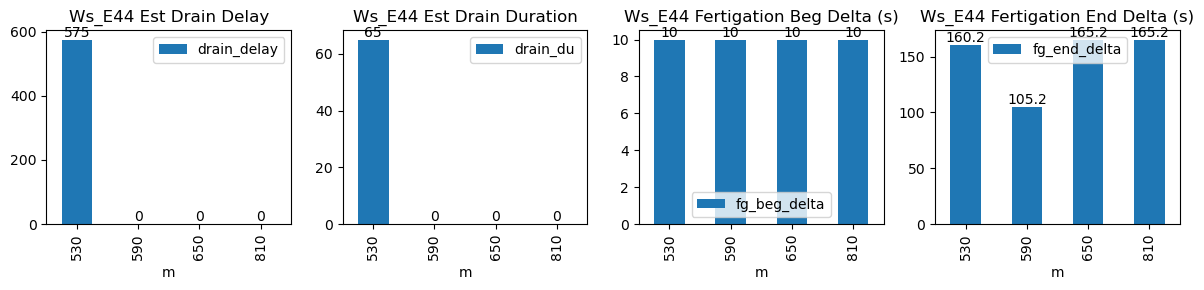
530 |
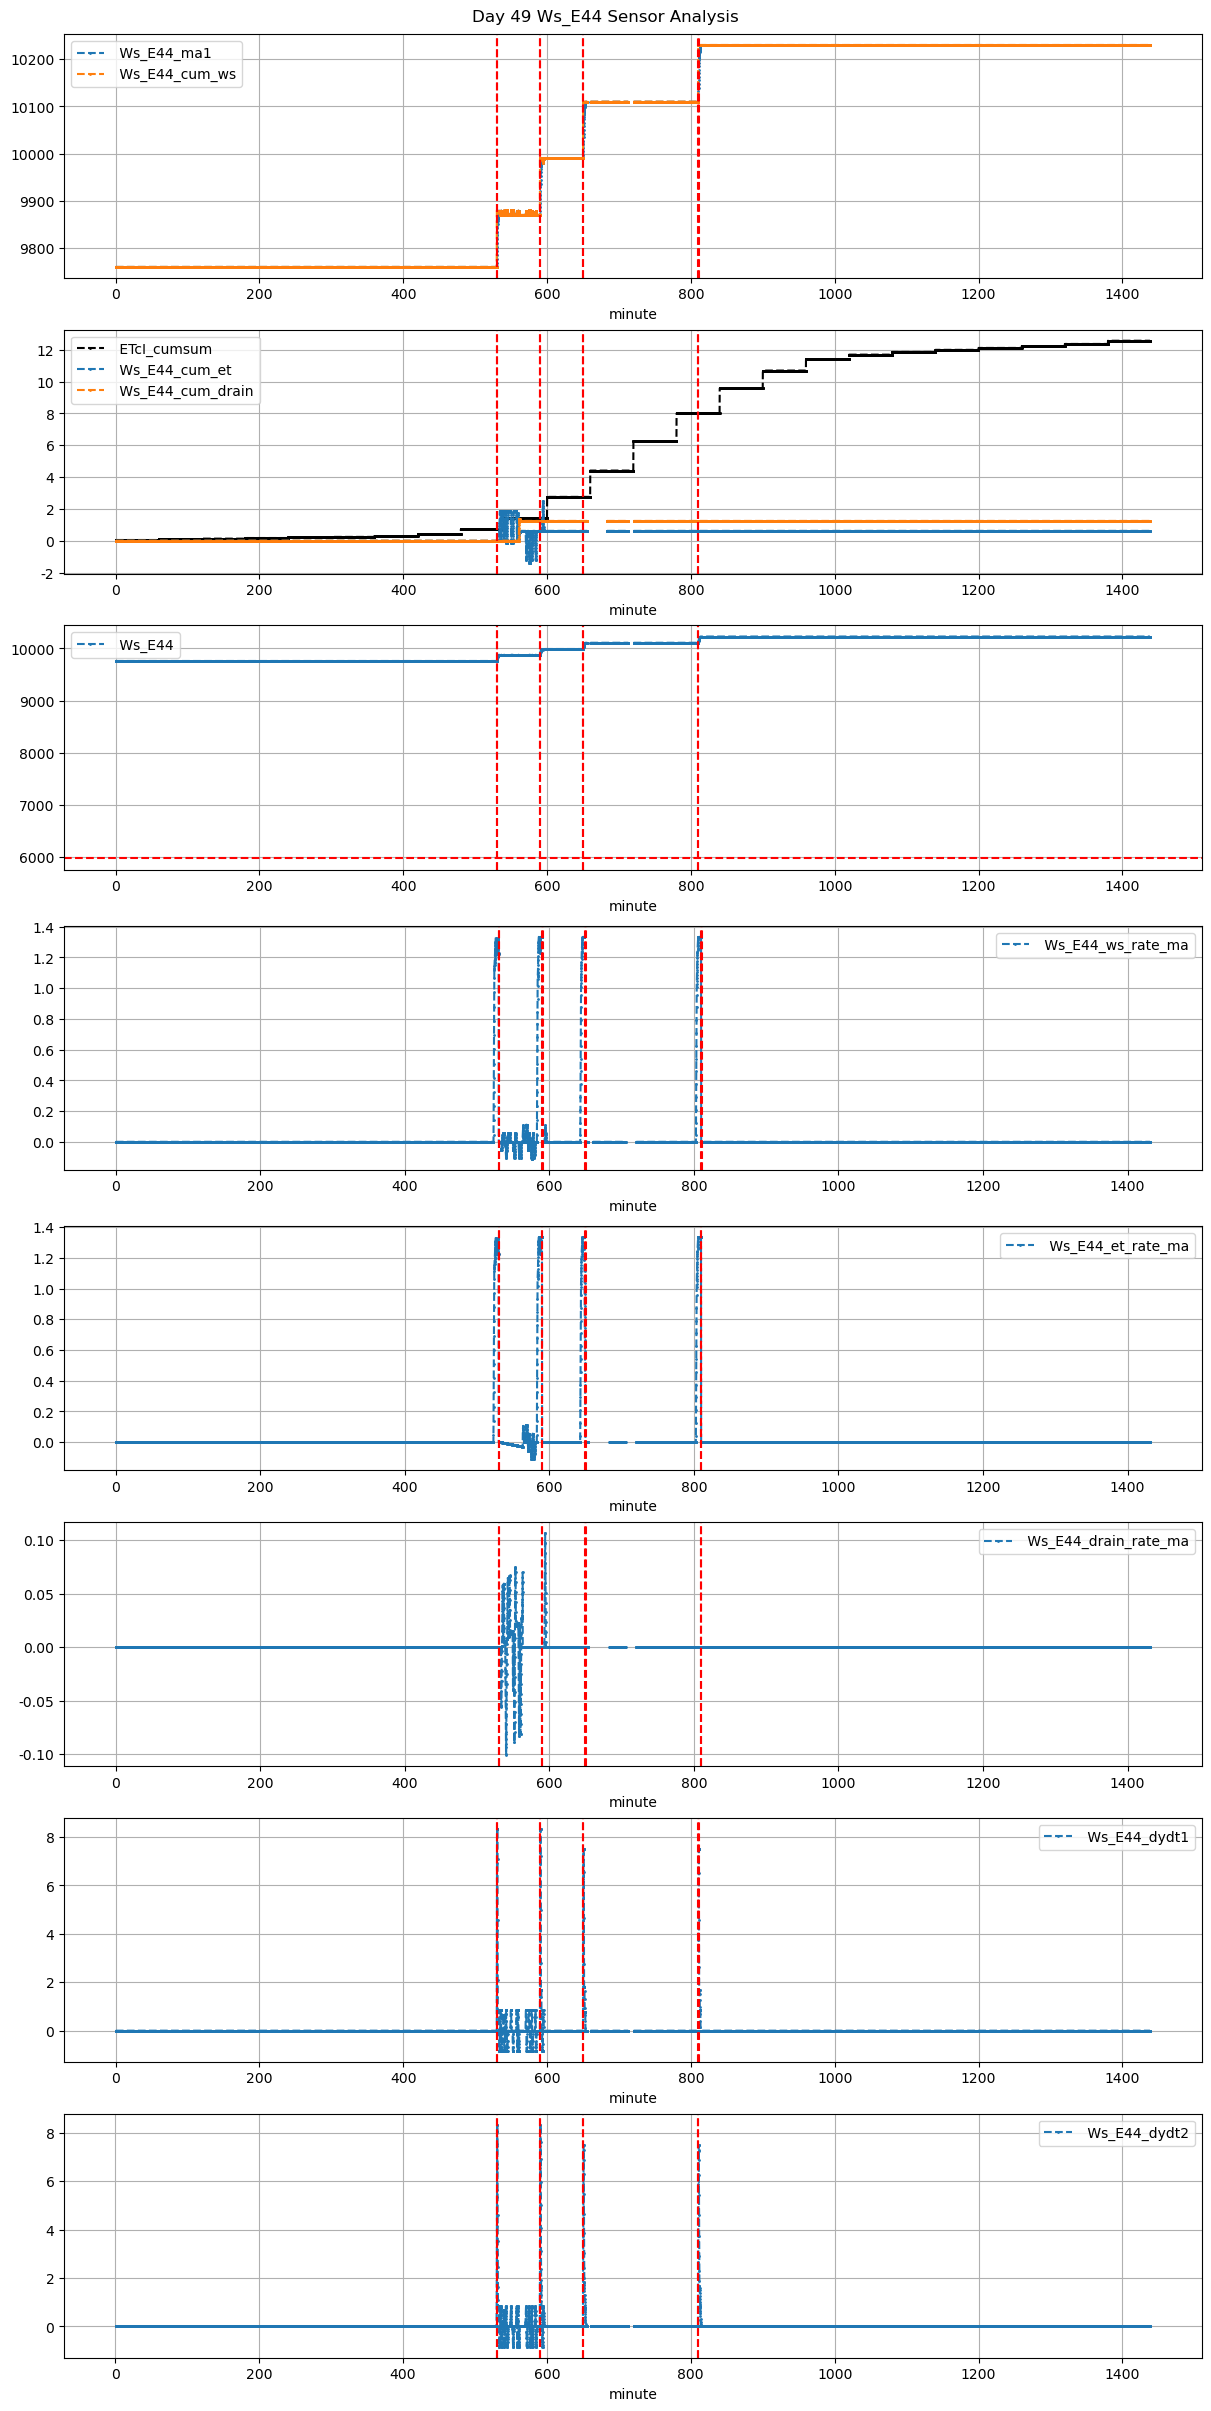
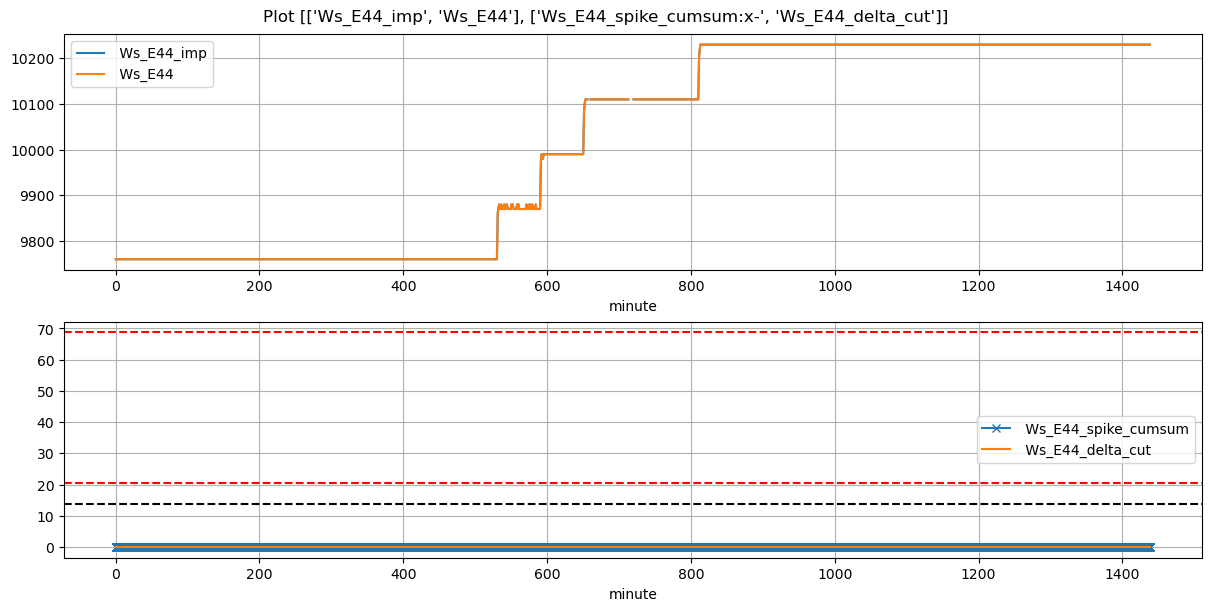
Ws_E44 |
1.452334 |
30 |
530.0 |
530.166667 |
530.58 |
533.250000 |
9760.0 |
9879.444444 |
35 |
0.000000 |
-0.005401 |
-0.028344 |
0.266190 |
0.682540 |
23.888889 |
True |
10.0 |
160.2 |
23.888889 |
0.0 |
0 |
0.0 |
65.0 |
575.0 |
-0.088879 |
NaN |
NaN |
NaN |
| 2025-11-24 09:50:00+08:00 |
49 |
590 |
Ws_E44 |
1.452334 |
30 |
590.0 |
590.166667 |
590.58 |
592.333333 |
9870.0 |
9990.000000 |
35 |
-0.024761 |
0.000000 |
0.000000 |
0.303333 |
0.685714 |
24.000000 |
True |
10.0 |
105.2 |
24.000000 |
0.0 |
0 |
0.0 |
NaN |
NaN |
NaN |
NaN |
NaN |
NaN |
| 2025-11-24 10:50:00+08:00 |
49 |
650 |
Ws_E44 |
1.452334 |
30 |
650.0 |
650.166667 |
650.58 |
653.333333 |
9990.0 |
10110.000000 |
35 |
0.000000 |
0.000000 |
0.000000 |
0.241948 |
0.685714 |
24.000000 |
True |
10.0 |
165.2 |
24.000000 |
0.0 |
0 |
0.0 |
NaN |
NaN |
NaN |
NaN |
NaN |
NaN |
| 2025-11-24 13:30:00+08:00 |
49 |
810 |
Ws_E44 |
1.452334 |
30 |
810.0 |
810.166667 |
810.58 |
813.333333 |
10110.0 |
10230.000000 |
35 |
0.000000 |
0.000000 |
0.000000 |
0.241429 |
0.685714 |
24.000000 |
True |
10.0 |
165.2 |
24.000000 |
0.0 |
0 |
0.0 |
NaN |
NaN |
NaN |
NaN |
NaN |
NaN |