| 2025-11-23 09:00:00+08:00 |
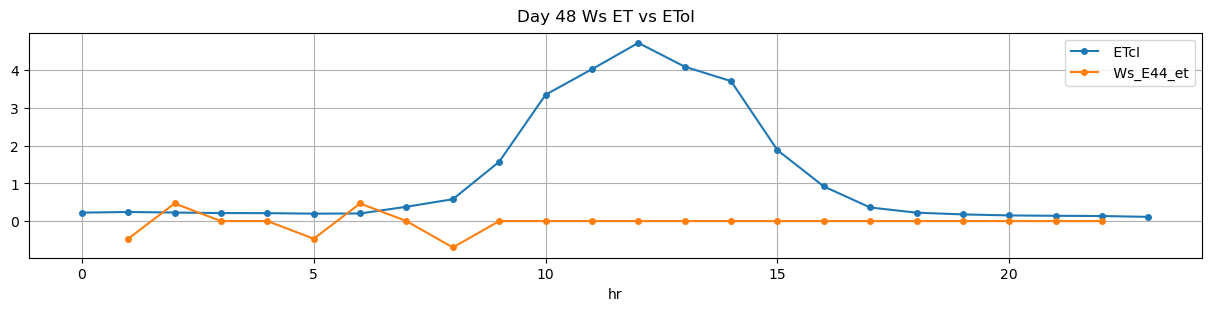
48 |
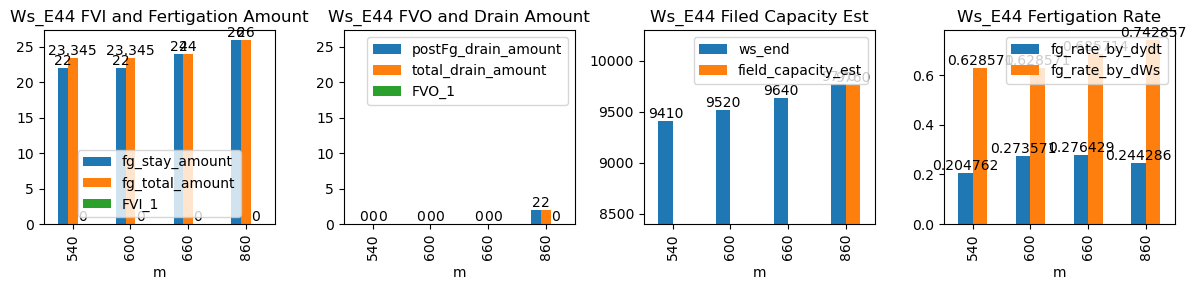
540 |
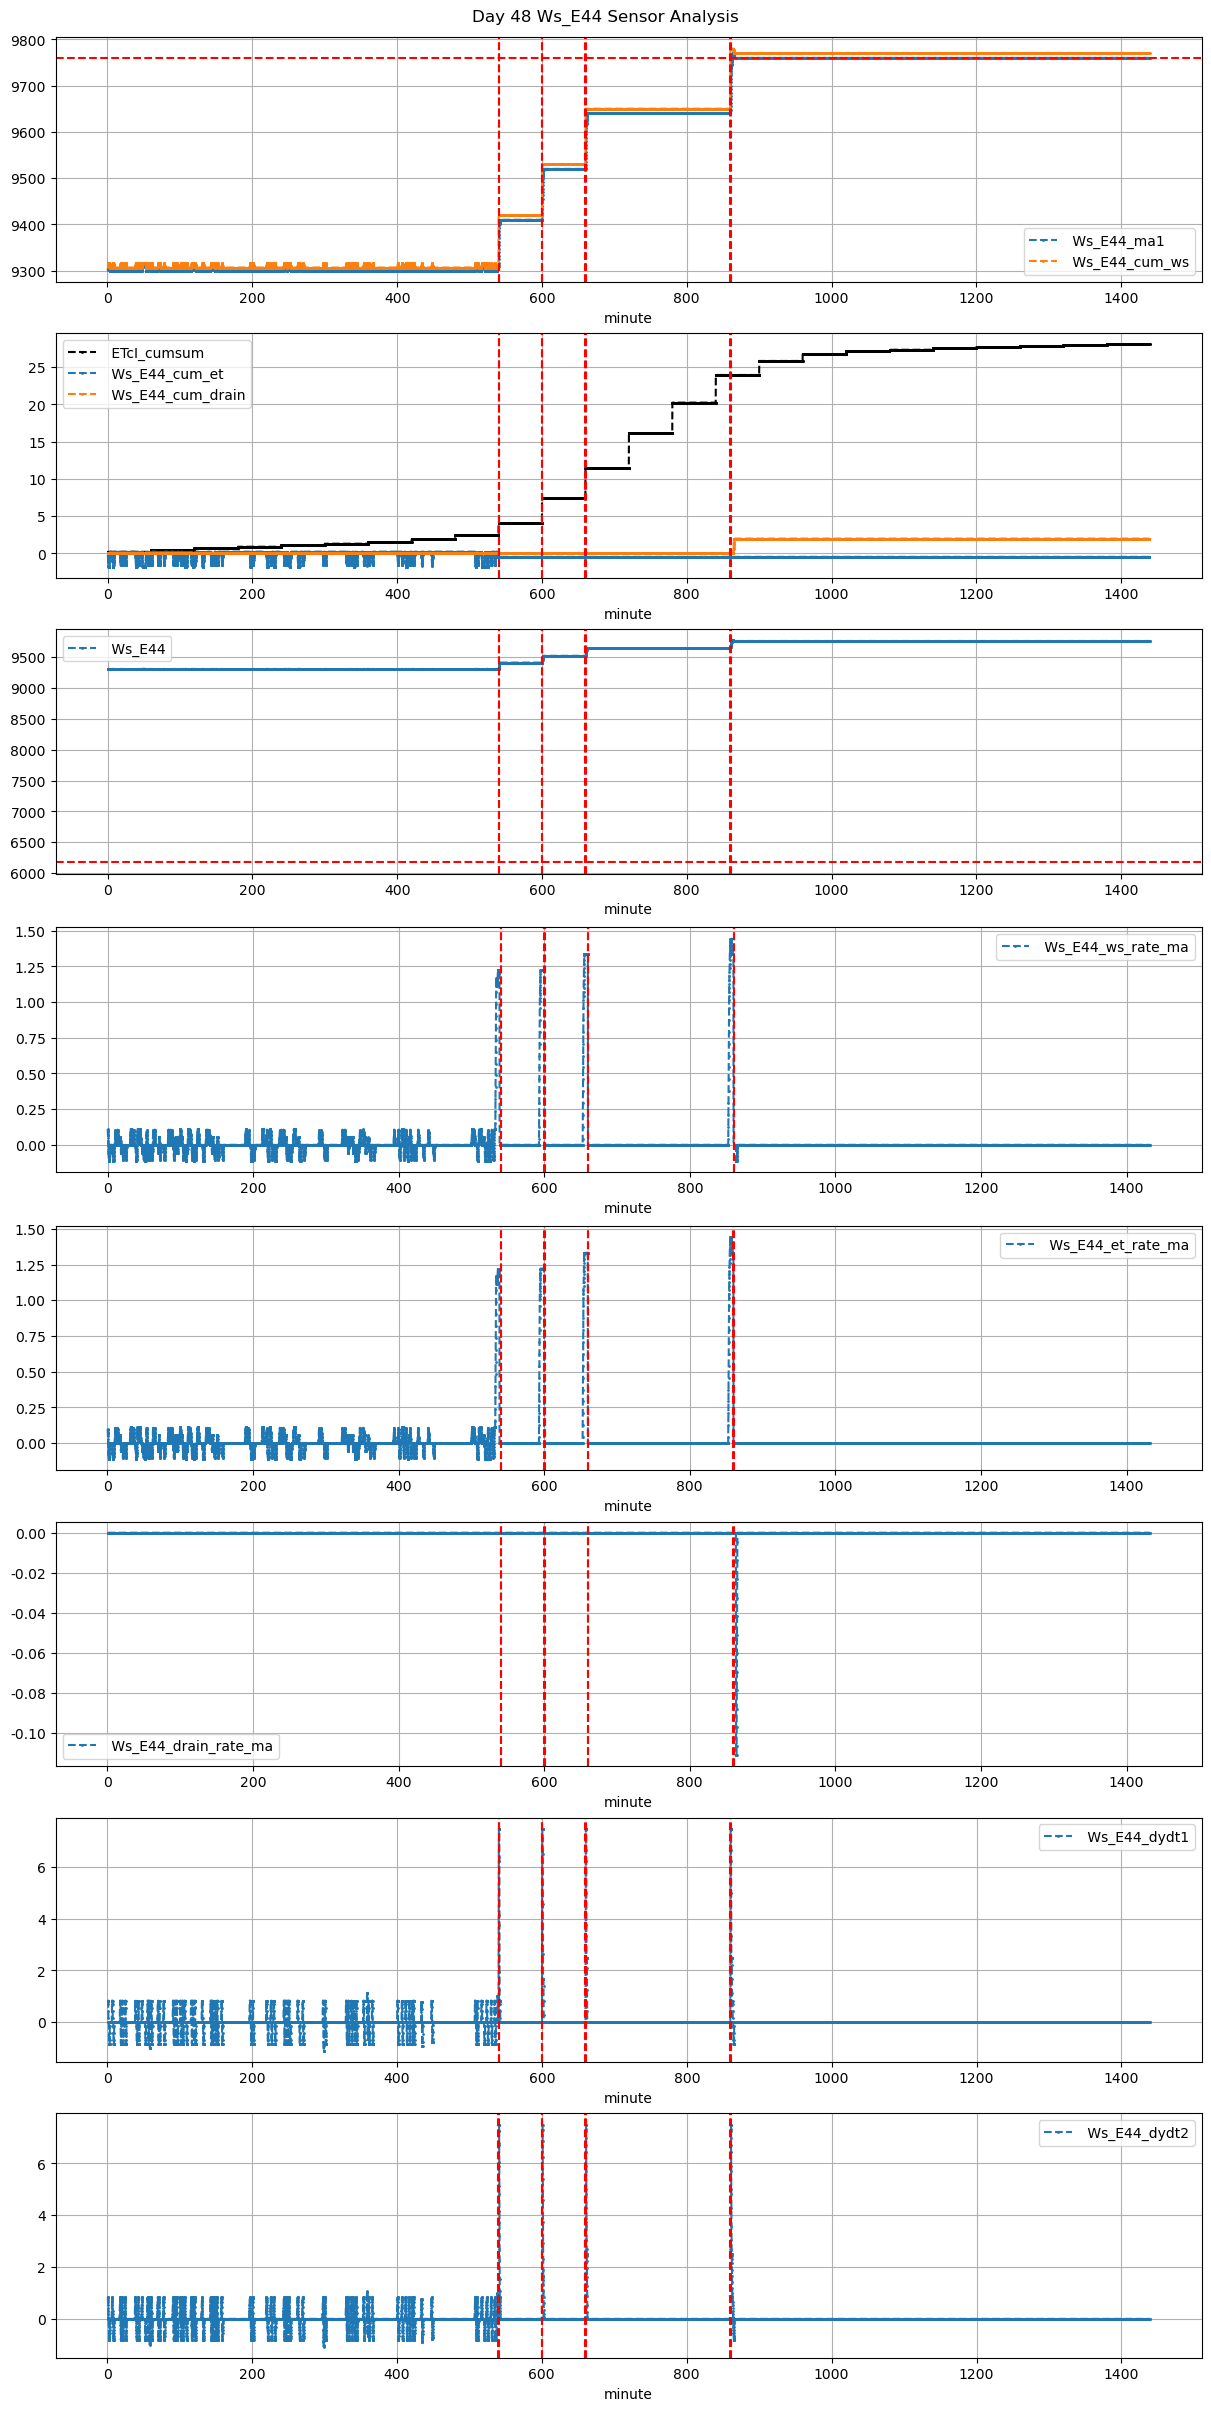
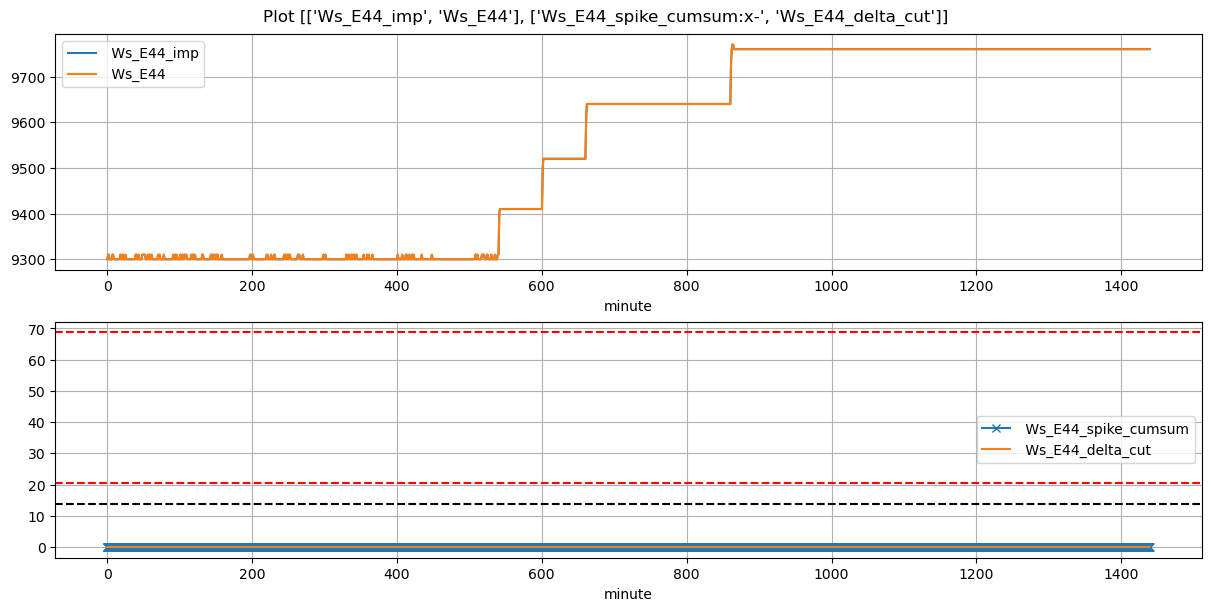
Ws_E44 |
1.390727 |
30 |
540.0 |
538.583333 |
540.58 |
542.333333 |
9300.0 |
9410.0 |
35 |
-0.027403 |
0.000000 |
0.0 |
0.204762 |
0.628571 |
22.0 |
True |
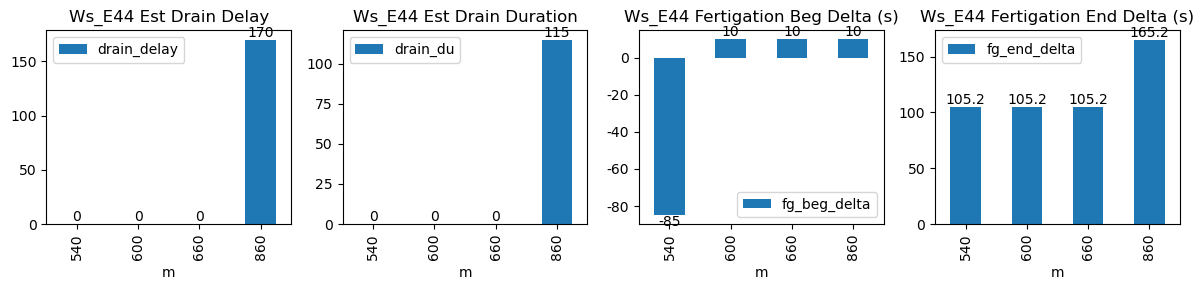
-85.0 |
105.2 |
23.345 |
0.0 |
0.0 |
0.0 |
NaN |
NaN |
NaN |
NaN |
NaN |
NaN |
| 2025-11-23 10:00:00+08:00 |
48 |
600 |
Ws_E44 |
1.390727 |
30 |
600.0 |
600.166667 |
600.58 |
602.333333 |
9410.0 |
9520.0 |
35 |
0.000000 |
0.000000 |
0.0 |
0.273571 |
0.628571 |
22.0 |
True |
10.0 |
105.2 |
23.345 |
0.0 |
0.0 |
0.0 |
NaN |
NaN |
NaN |
NaN |
NaN |
NaN |
| 2025-11-23 11:00:00+08:00 |
48 |
660 |
Ws_E44 |
1.390727 |
30 |
660.0 |
660.166667 |
660.58 |
662.333333 |
9520.0 |
9640.0 |
35 |
0.000000 |
0.000000 |
0.0 |
0.276429 |
0.685714 |
24.0 |
True |
10.0 |
105.2 |
24.000 |
0.0 |
0.0 |
0.0 |
NaN |
NaN |
NaN |
NaN |
NaN |
NaN |
| 2025-11-23 14:20:00+08:00 |
48 |
860 |
Ws_E44 |
1.390727 |
30 |
860.0 |
860.166667 |
860.58 |
863.333333 |
9640.0 |
9770.0 |
35 |
0.000000 |
-0.022222 |
0.0 |
0.244286 |
0.742857 |
26.0 |
True |
10.0 |
165.2 |
26.000 |
0.0 |
2.0 |
2.0 |
115.0 |
170.0 |
-0.111111 |
9760.0 |
NaN |
NaN |