| 2025-11-22 09:00:00+08:00 |
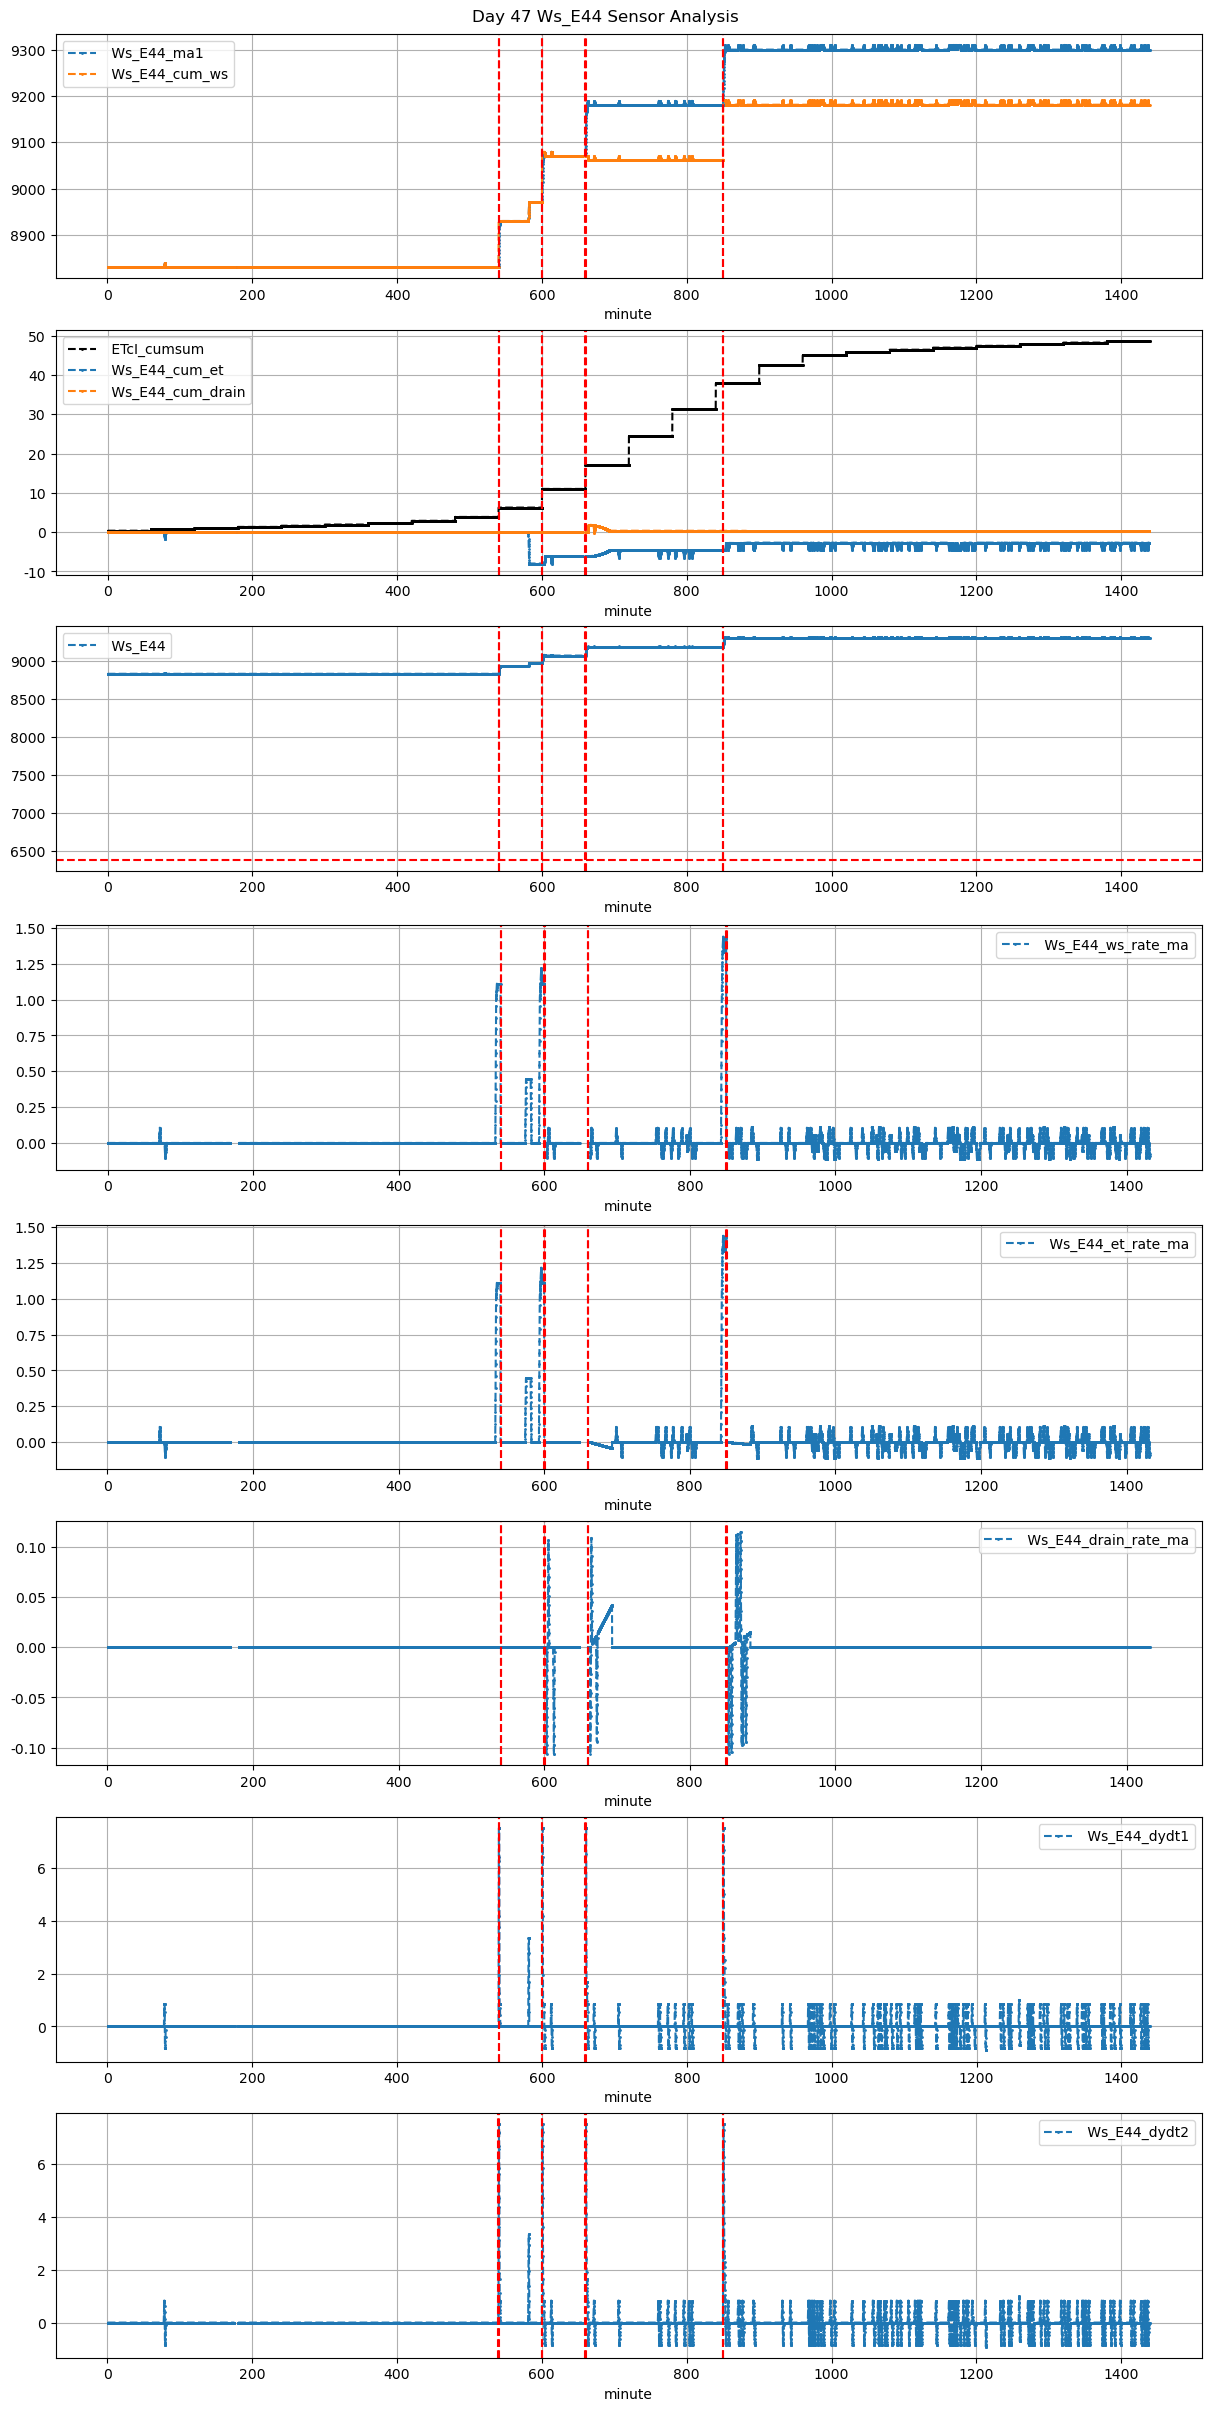
47 |
540 |
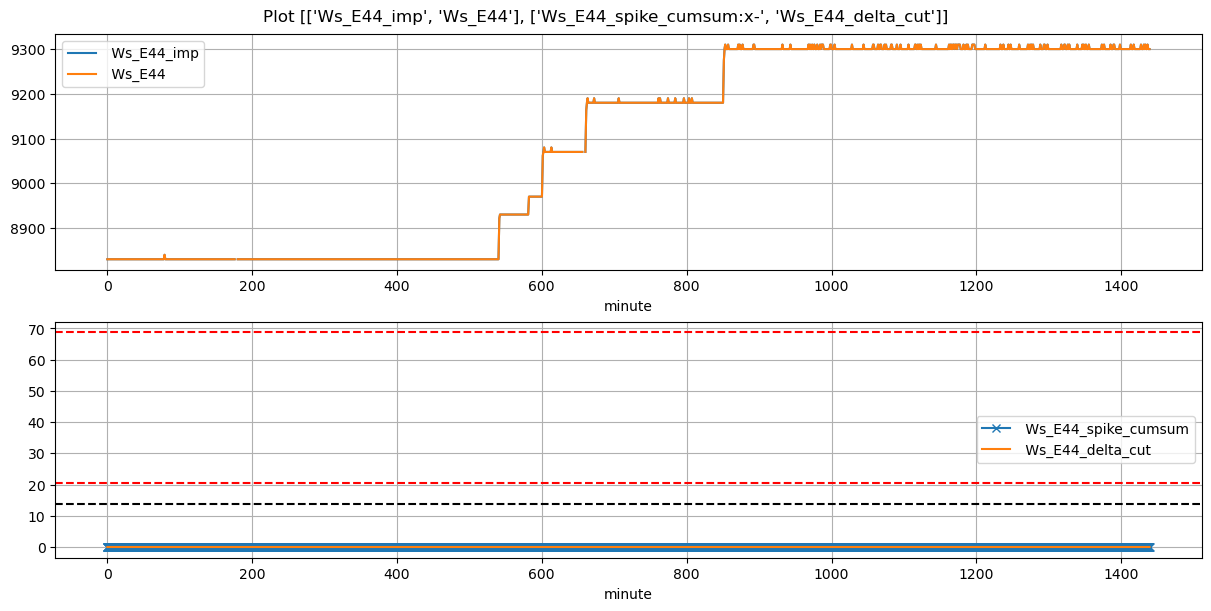
Ws_E44 |
1.411194 |
30 |
540.0 |
540.25 |
540.55 |
542.333333 |
8830.0 |
8930.000000 |
33 |
0.000000 |
0.000000 |
0.000000 |
0.287500 |
0.606061 |
20.000000 |
True |
15.0 |
107.0 |
21.351000 |
0.0 |
0.0 |
0.0 |
NaN |
NaN |
NaN |
NaN |
NaN |
NaN |
| 2025-11-22 10:00:00+08:00 |
47 |
600 |
Ws_E44 |
1.411194 |
30 |
600.0 |
600.25 |
600.55 |
603.250000 |
8970.0 |
9079.444444 |
33 |
0.000000 |
0.000000 |
0.000000 |
0.256667 |
0.663300 |
21.888889 |
True |
15.0 |
162.0 |
21.888889 |
0.0 |
0.0 |
0.0 |
60.0 |
167.0 |
-0.106481 |
NaN |
NaN |
NaN |
| 2025-11-22 11:00:00+08:00 |
47 |
660 |
Ws_E44 |
1.411194 |
30 |
660.0 |
NaN |
660.55 |
663.250000 |
9070.0 |
9189.444444 |
33 |
-0.042031 |
0.000000 |
-0.042031 |
NaN |
0.723906 |
23.888889 |
False |
NaN |
162.0 |
NaN |
0.0 |
0.0 |
0.0 |
NaN |
NaN |
NaN |
NaN |
NaN |
NaN |
| 2025-11-22 14:10:00+08:00 |
47 |
850 |
Ws_E44 |
1.411194 |
30 |
850.0 |
850.25 |
850.55 |
853.250000 |
9180.0 |
9309.444444 |
33 |
0.000000 |
-0.023405 |
-0.014815 |
0.260000 |
0.784512 |
25.888889 |
True |
15.0 |
162.0 |
25.888889 |
0.0 |
0.0 |
0.0 |
60.0 |
167.0 |
-0.097159 |
NaN |
NaN |
NaN |