| 2025-11-21 08:11:07+08:00 |
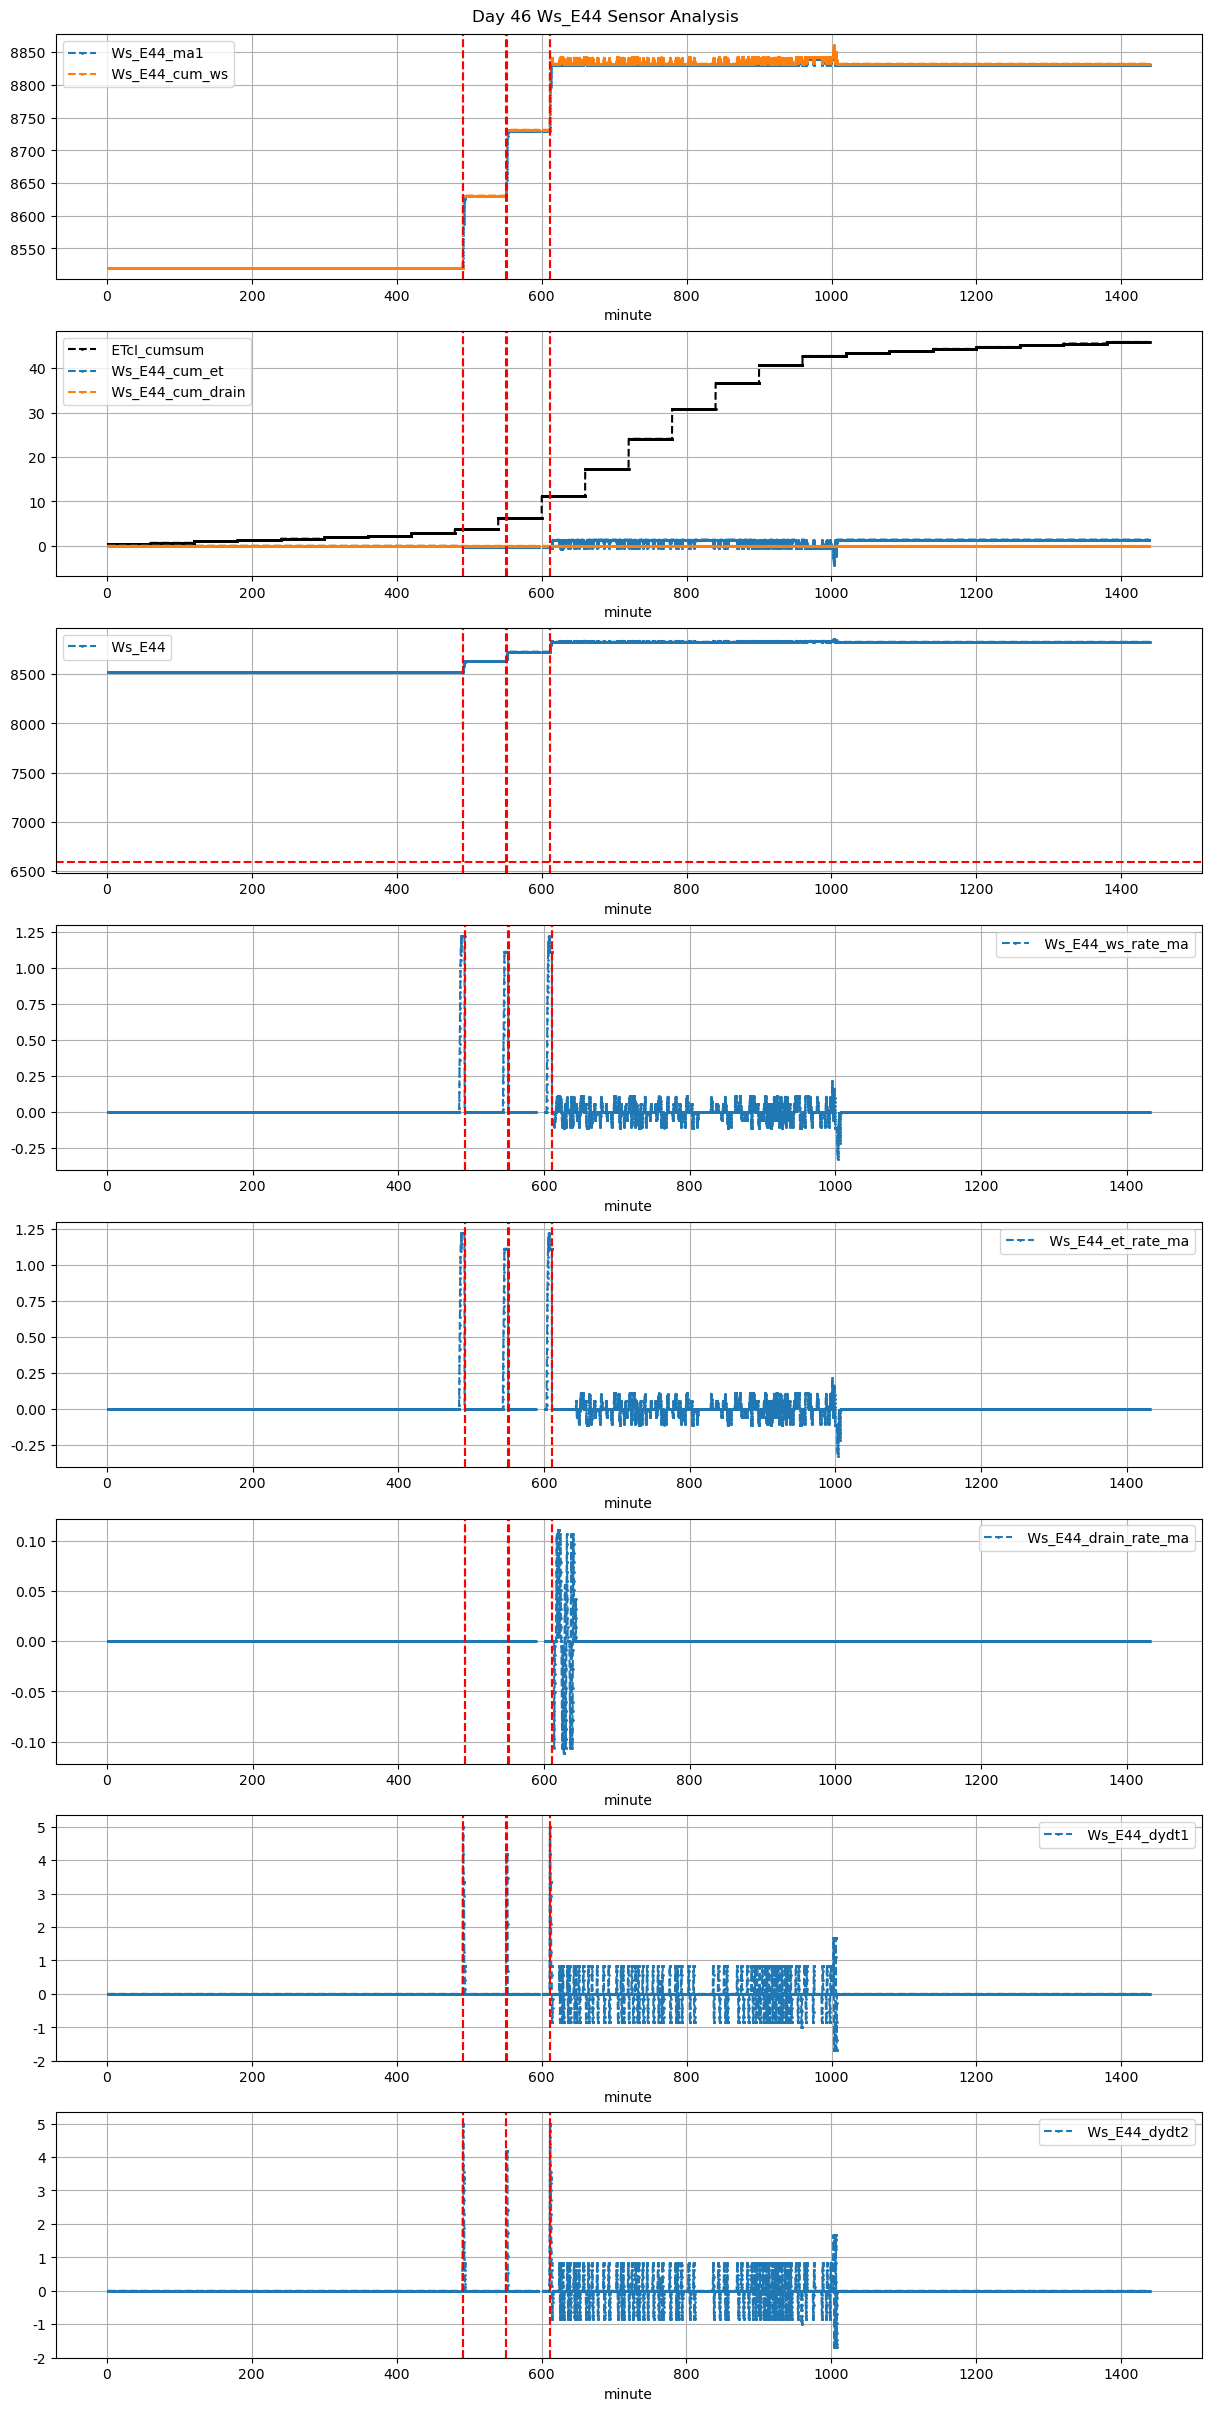
46 |
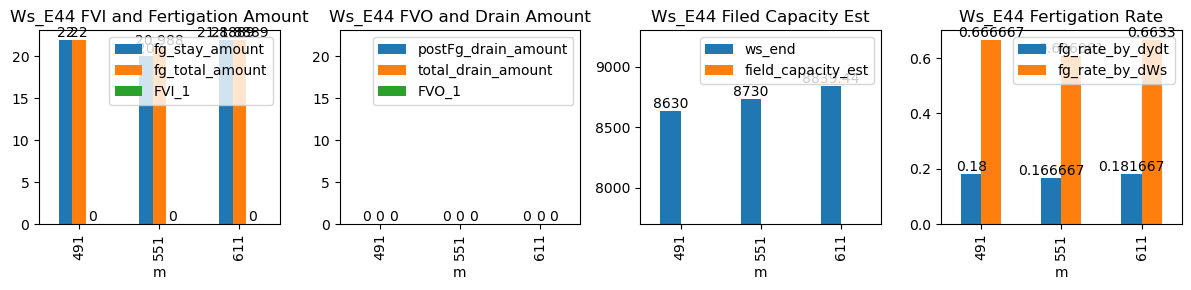
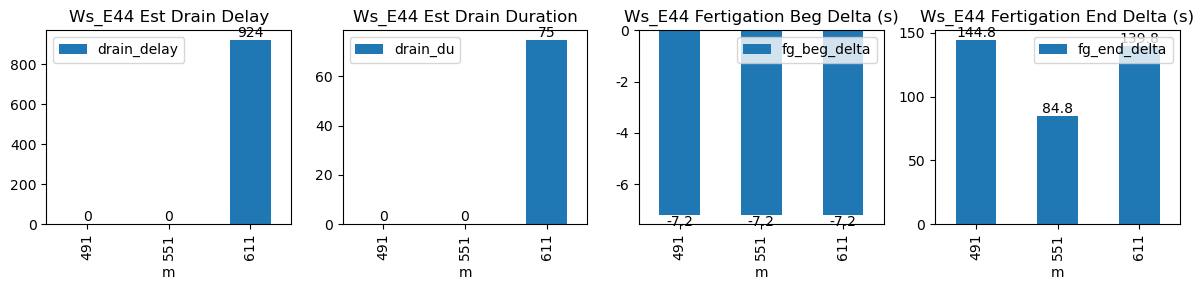
491 |
Ws_E44 |
1.562358 |
30 |
491.12 |
491.0 |
491.67 |
494.083333 |
8520.0 |
8630.000000 |
33 |
0.0 |
0.0 |
0.0 |
0.180000 |
0.666667 |
22.000000 |
True |
-7.2 |
144.8 |
22.000000 |
0.0 |
0 |
0.0 |
NaN |
NaN |
NaN |
NaN |
NaN |
NaN |
| 2025-11-21 09:11:07+08:00 |
46 |
551 |
Ws_E44 |
1.562358 |
30 |
551.12 |
551.0 |
551.67 |
553.083333 |
8630.0 |
8730.000000 |
33 |
0.0 |
0.0 |
0.0 |
0.166667 |
0.606061 |
20.000000 |
True |
-7.2 |
84.8 |
20.988000 |
0.0 |
0 |
0.0 |
NaN |
NaN |
NaN |
NaN |
NaN |
NaN |
| 2025-11-21 10:11:07+08:00 |
46 |
611 |
Ws_E44 |
1.562358 |
30 |
611.12 |
611.0 |
611.67 |
614.000000 |
8730.0 |
8839.444444 |
33 |
0.0 |
0.0 |
0.0 |
0.181667 |
0.663300 |
21.888889 |
True |
-7.2 |
139.8 |
21.888889 |
0.0 |
0 |
0.0 |
75.0 |
924.0 |
-0.106713 |
NaN |
NaN |
NaN |