| 2025-11-20 08:45:00+08:00 |
45 |
525 |
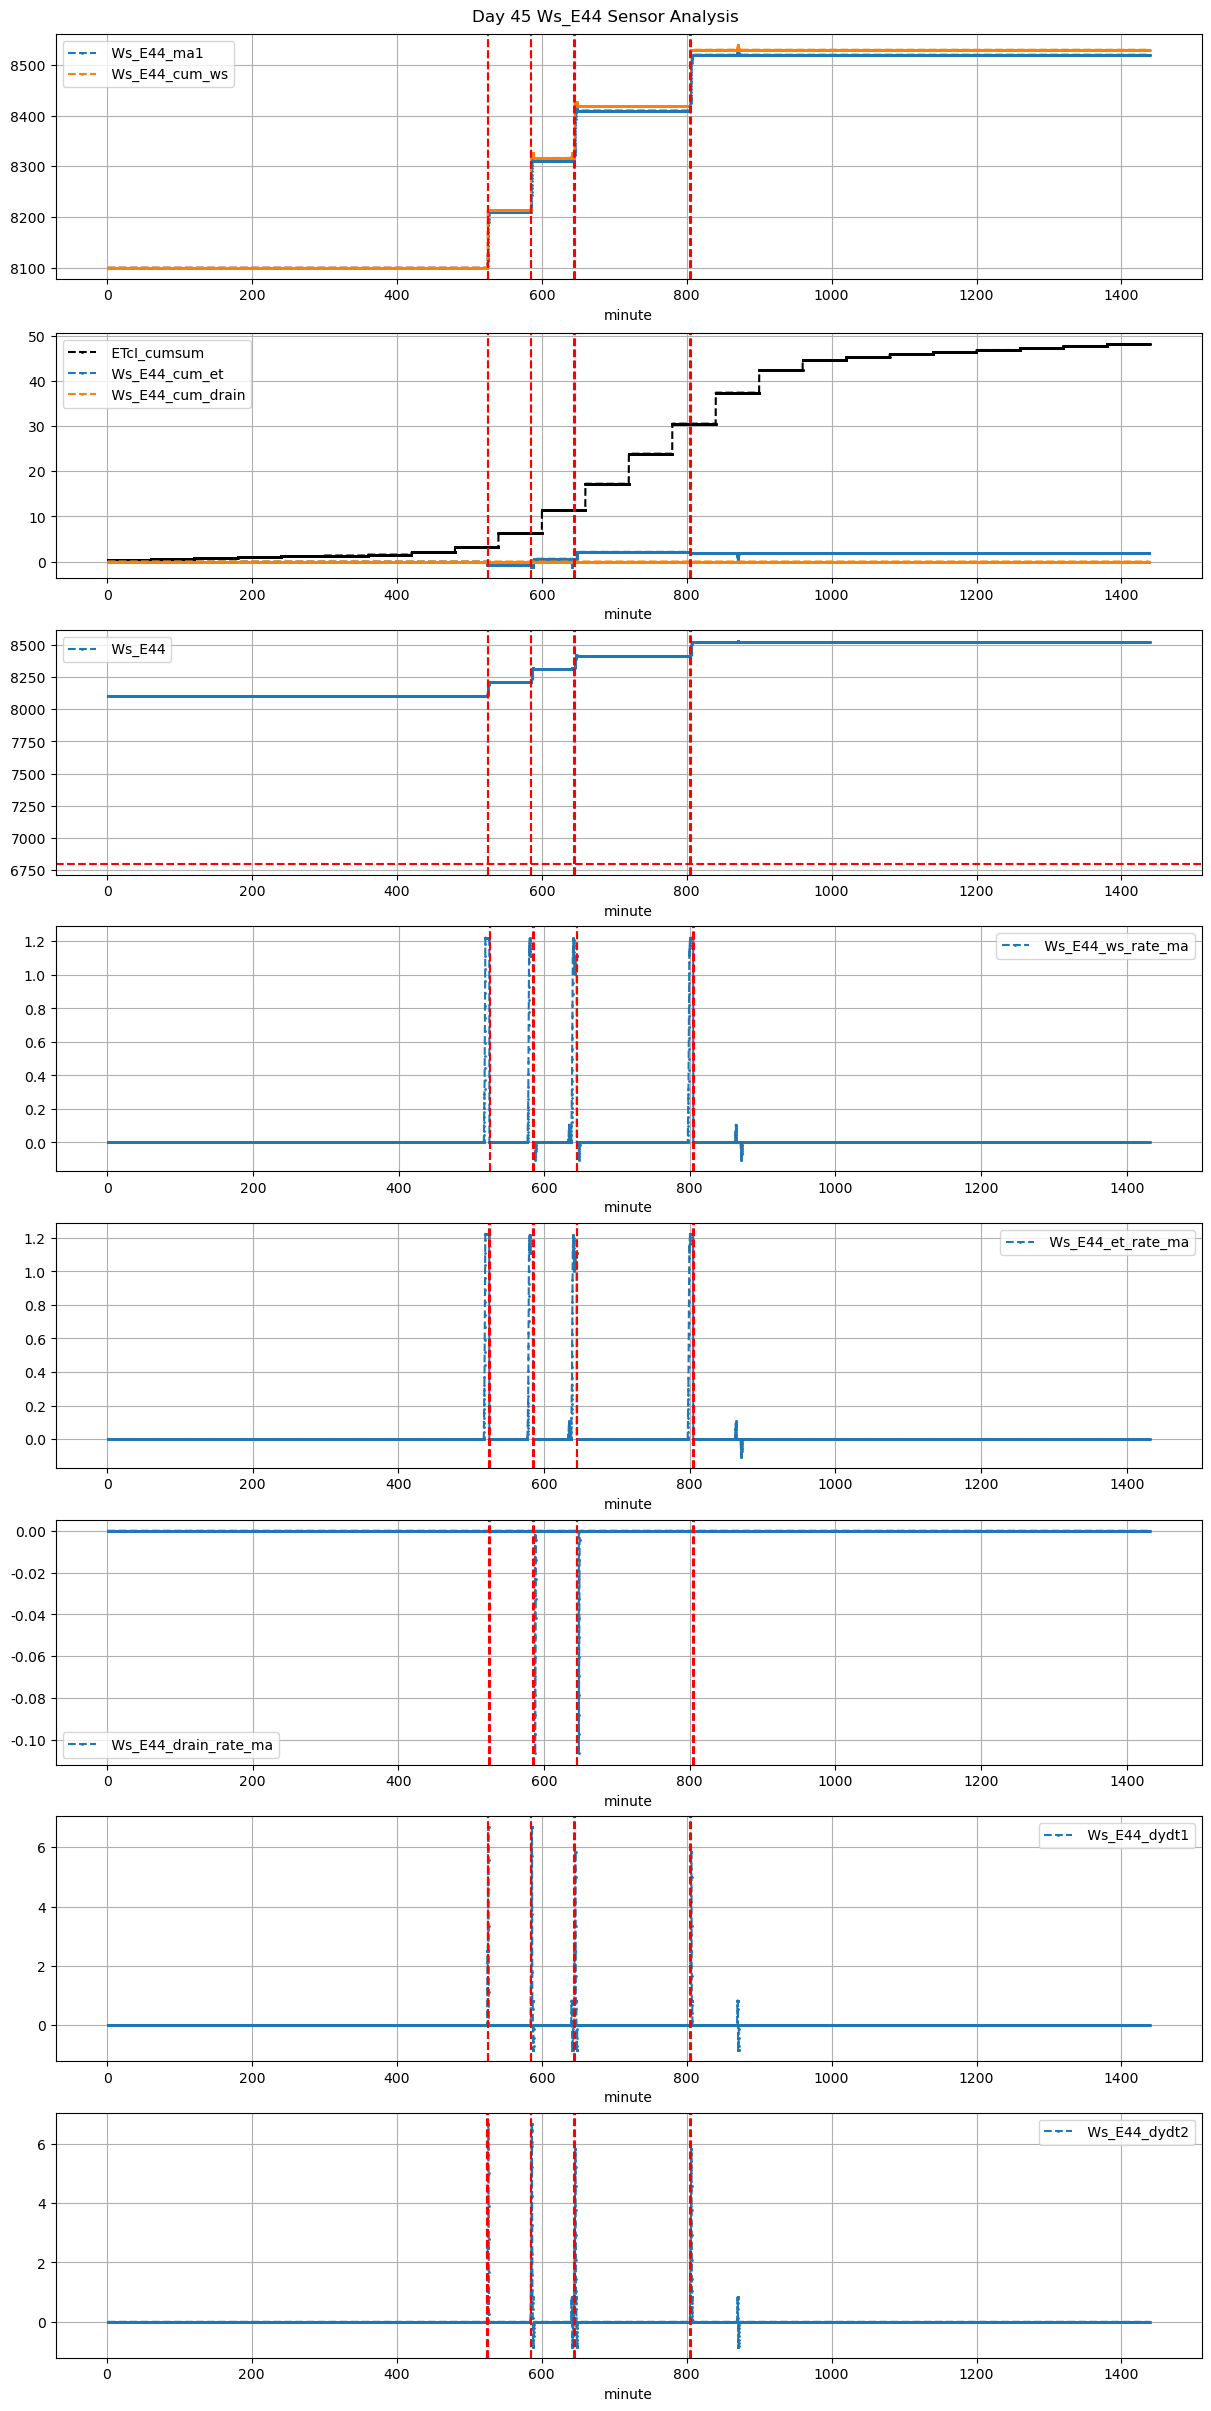
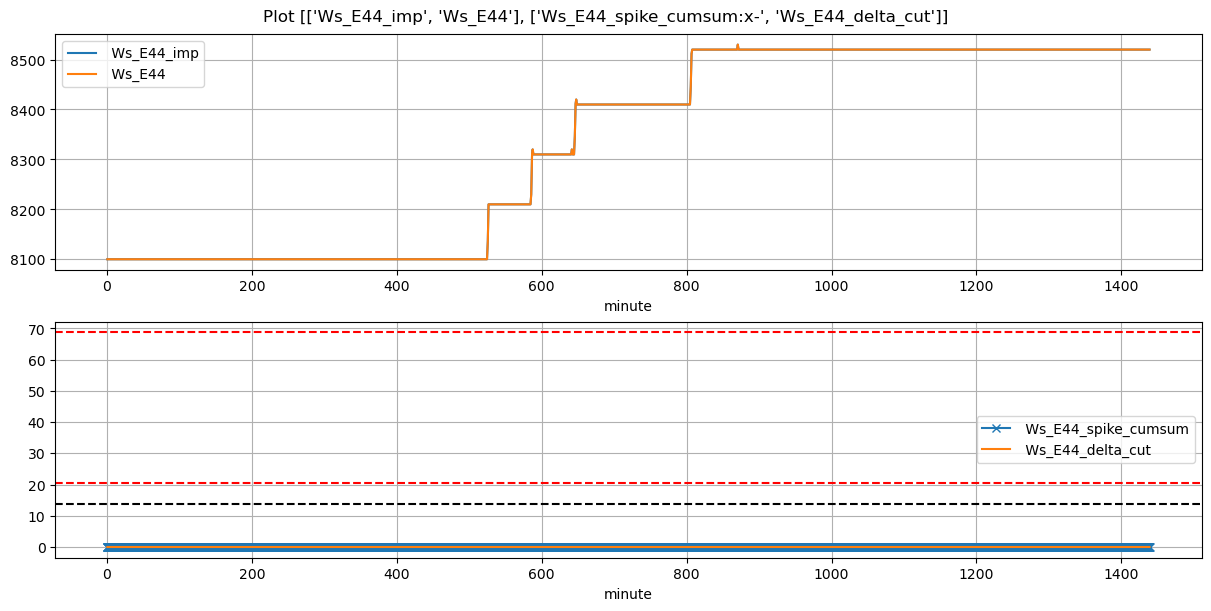
Ws_E44 |
1.426948 |
30 |
525.0 |
524.75 |
525.55 |
526.666667 |
8100.0 |
8210.000000 |
33 |
0.0 |
0.000000 |
0.0 |
0.257222 |
0.666667 |
22.000000 |
True |
-15.0 |
67.0 |
22.000000 |
0.0 |
0 |
0.0 |
NaN |
NaN |
NaN |
NaN |
NaN |
NaN |
| 2025-11-20 09:45:00+08:00 |
45 |
585 |
Ws_E44 |
1.426948 |
30 |
585.0 |
584.75 |
585.55 |
587.583333 |
8210.0 |
8319.444444 |
33 |
0.0 |
-0.008591 |
0.0 |
0.238333 |
0.663300 |
21.888889 |
True |
-15.0 |
122.0 |
21.888889 |
0.0 |
0 |
0.0 |
60.0 |
127.0 |
-0.101389 |
NaN |
NaN |
NaN |
| 2025-11-20 10:45:00+08:00 |
45 |
645 |
Ws_E44 |
1.426948 |
30 |
645.0 |
644.75 |
645.55 |
647.666667 |
8310.0 |
8419.444444 |
33 |
0.0 |
-0.008591 |
0.0 |
0.208333 |
0.663300 |
21.888889 |
True |
-15.0 |
127.0 |
21.888889 |
0.0 |
0 |
0.0 |
60.0 |
132.0 |
-0.101389 |
NaN |
NaN |
NaN |
| 2025-11-20 13:25:00+08:00 |
45 |
805 |
Ws_E44 |
1.426948 |
30 |
805.0 |
804.75 |
805.55 |
807.750000 |
8410.0 |
8520.000000 |
33 |
0.0 |
0.000000 |
0.0 |
0.206667 |
0.666667 |
22.000000 |
True |
-15.0 |
132.0 |
22.000000 |
0.0 |
0 |
0.0 |
NaN |
NaN |
NaN |
NaN |
NaN |
NaN |